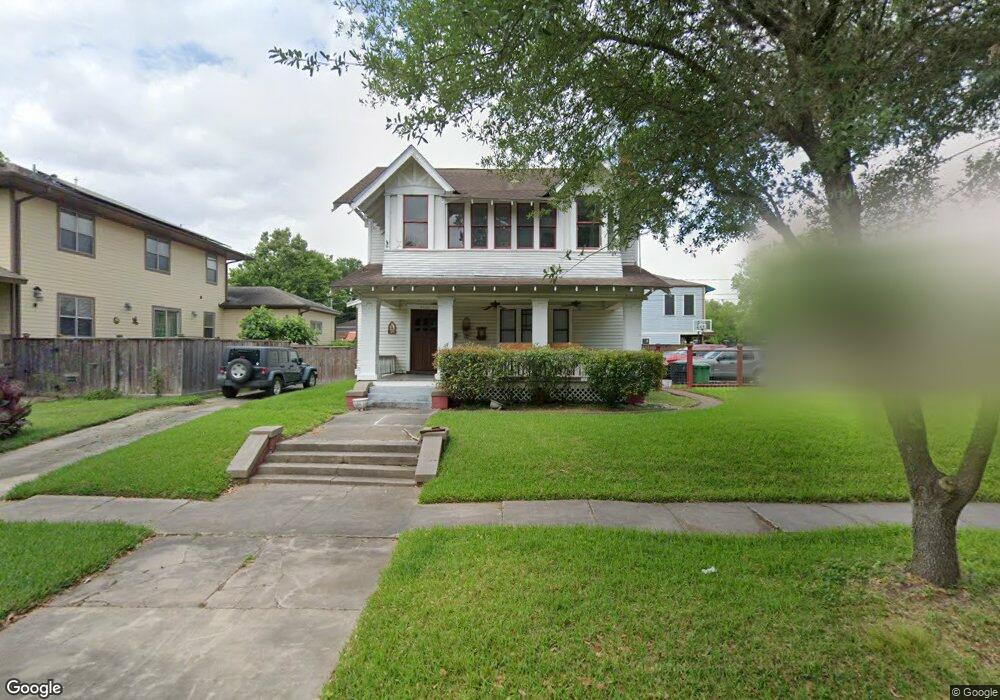
4631 Walker St Unit 2 Houston, TX 77023
Eastwood NeighborhoodEstimated Value: $681,514 - $818,000
6
Beds
2
Baths
3,770
Sq Ft
$198/Sq Ft
Est. Value
About This Home
This home is located at 4631 Walker St Unit 2, Houston, TX 77023 and is currently estimated at $745,629, approximately $197 per square foot. 4631 Walker St Unit 2 is a home located in Harris County with nearby schools including Lantrip Elementary School, Yolanda Black Navarro Middle School, and Austin High School.
Ownership History
Date
Name
Owned For
Owner Type
Purchase Details
Closed on
Oct 8, 1999
Sold by
Espinoza John A
Bought by
Rodriguez Albert H and Rodriguez Tresa
Current Estimated Value
Home Financials for this Owner
Home Financials are based on the most recent Mortgage that was taken out on this home.
Original Mortgage
$63,000
Outstanding Balance
$19,124
Interest Rate
7.9%
Estimated Equity
$726,505
Create a Home Valuation Report for This Property
The Home Valuation Report is an in-depth analysis detailing your home's value as well as a comparison with similar homes in the area
Home Values in the Area
Average Home Value in this Area
Purchase History
| Date | Buyer | Sale Price | Title Company |
|---|---|---|---|
| Rodriguez Albert H | -- | Regency Title Company |
Source: Public Records
Mortgage History
| Date | Status | Borrower | Loan Amount |
|---|---|---|---|
| Open | Rodriguez Albert H | $63,000 | |
| Closed | Rodriguez Albert H | $24,100 |
Source: Public Records
Tax History Compared to Growth
Tax History
| Year | Tax Paid | Tax Assessment Tax Assessment Total Assessment is a certain percentage of the fair market value that is determined by local assessors to be the total taxable value of land and additions on the property. | Land | Improvement |
|---|---|---|---|---|
| 2025 | $4,403 | $560,448 | $420,000 | $140,448 |
| 2024 | $4,403 | $563,777 | $420,000 | $143,777 |
| 2023 | $4,403 | $574,838 | $420,000 | $154,838 |
| 2022 | $11,145 | $530,106 | $399,000 | $131,106 |
| 2021 | $10,041 | $459,051 | $336,000 | $123,051 |
| 2020 | $10,071 | $451,011 | $336,000 | $115,011 |
| 2019 | $9,543 | $396,870 | $283,500 | $113,370 |
| 2018 | $6,283 | $380,068 | $210,000 | $170,068 |
| 2017 | $7,882 | $380,068 | $210,000 | $170,068 |
| 2016 | $7,165 | $364,611 | $210,000 | $154,611 |
| 2015 | $4,391 | $333,253 | $143,850 | $189,403 |
| 2014 | $4,391 | $265,319 | $126,000 | $139,319 |
Source: Public Records
Map
Nearby Homes