Estimated Value: $275,365 - $323,000
4
Beds
2
Baths
1,366
Sq Ft
$220/Sq Ft
Est. Value
About This Home
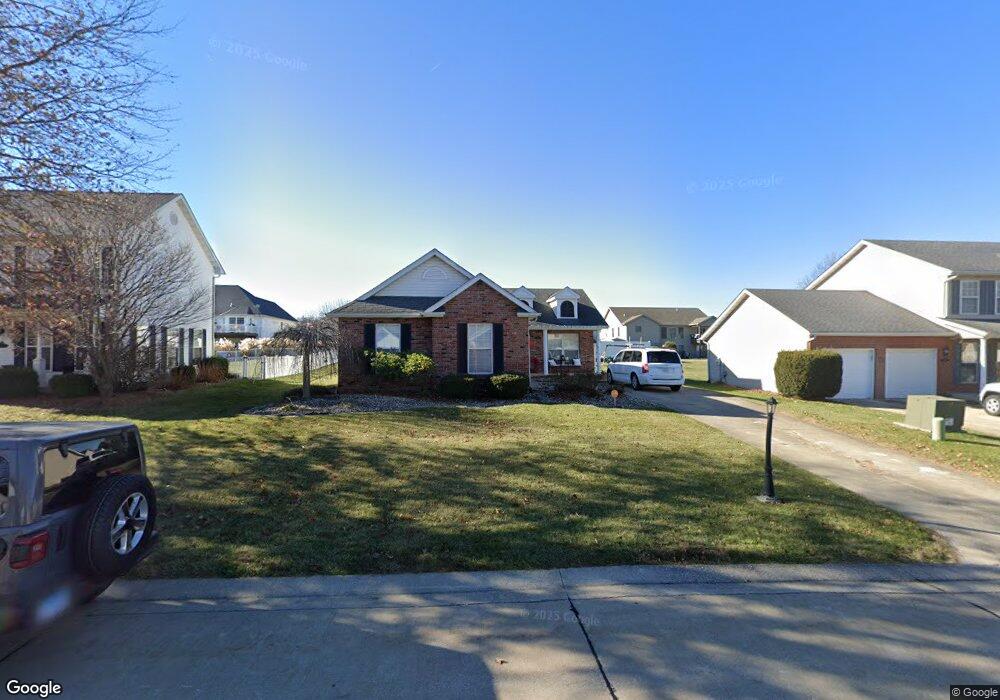
This home is located at 4632 Camellia Place, Alton, IL 62002 and is currently estimated at $301,091, approximately $220 per square foot. 4632 Camellia Place is a home located in Madison County with nearby schools including Eunice Smith Elementary School, Alton Middle School, and Alton High School.
Ownership History
Date
Name
Owned For
Owner Type
Purchase Details
Closed on
Jul 25, 2008
Sold by
Gibbs Susan K and Delp Susan K
Bought by
Gosling Ryan C and Gosling Kristen R
Current Estimated Value
Home Financials for this Owner
Home Financials are based on the most recent Mortgage that was taken out on this home.
Original Mortgage
$165,166
Outstanding Balance
$109,304
Interest Rate
6.5%
Mortgage Type
FHA
Estimated Equity
$191,787
Purchase Details
Closed on
May 8, 2007
Sold by
Gibbs Susan K
Bought by
Delp Susan K and Gibbs Susan K
Purchase Details
Closed on
May 10, 2006
Sold by
Klohr Claudia
Bought by
Gibbs Susan K
Home Financials for this Owner
Home Financials are based on the most recent Mortgage that was taken out on this home.
Original Mortgage
$31,000
Interest Rate
6.56%
Mortgage Type
Unknown
Create a Home Valuation Report for This Property
The Home Valuation Report is an in-depth analysis detailing your home's value as well as a comparison with similar homes in the area
Home Values in the Area
Average Home Value in this Area
Purchase History
| Date | Buyer | Sale Price | Title Company |
|---|---|---|---|
| Gosling Ryan C | $167,500 | Community Title & Escrow Ltd | |
| Delp Susan K | -- | Premier Title & Escrow Co | |
| Gibbs Susan K | $155,000 | Premier Title & Escrow Co |
Source: Public Records
Mortgage History
| Date | Status | Borrower | Loan Amount |
|---|---|---|---|
| Open | Gosling Ryan C | $165,166 | |
| Previous Owner | Gibbs Susan K | $31,000 | |
| Previous Owner | Gibbs Susan K | $124,000 |
Source: Public Records
Tax History Compared to Growth
Tax History
| Year | Tax Paid | Tax Assessment Tax Assessment Total Assessment is a certain percentage of the fair market value that is determined by local assessors to be the total taxable value of land and additions on the property. | Land | Improvement |
|---|---|---|---|---|
| 2024 | $5,144 | $82,300 | $15,370 | $66,930 |
| 2023 | $5,144 | $75,980 | $14,190 | $61,790 |
| 2022 | $4,882 | $69,490 | $12,980 | $56,510 |
| 2021 | $4,419 | $65,360 | $12,210 | $53,150 |
| 2020 | $4,331 | $63,950 | $11,950 | $52,000 |
| 2019 | $4,425 | $62,280 | $11,640 | $50,640 |
| 2018 | $4,354 | $59,630 | $11,150 | $48,480 |
| 2017 | $4,152 | $59,630 | $11,150 | $48,480 |
| 2016 | $4,034 | $59,630 | $11,150 | $48,480 |
| 2015 | $3,616 | $57,750 | $10,800 | $46,950 |
| 2014 | $3,616 | $57,750 | $10,800 | $46,950 |
| 2013 | $3,616 | $57,750 | $10,800 | $46,950 |
Source: Public Records
Map
Nearby Homes
- 4803 Azalea Place Unit 1
- 4801 Azalea Place Unit 2
- 4824 Azalea Place Unit 2
- 4814 Azalea Place Unit 2
- 0 Happy Ct
- 4900 Happy Dr
- 4805 Wick Mor Dr
- 2362 Briarcliff Dr
- 4407 Thadway Dr
- 2401 Crislisa Dr
- 0 Humbert Rd Unit MAR25006502
- 0 Humbert Rd Unit MAR25003159
- 4408 Natchez Ln
- 0 Humbert Rd Unit MIS25052876
- 5661 Humbert Rd
- 4442 Delta Queen Ln
- 5667 Humbert Rd
- 421 Saint John Dr
- 00 Pine Ridge Lot#52 Dr
- 212 Pine Ridge Dr
- 4632 Camellia Place
- 4634 Camellia Place
- 4634 Camellia
- 4630 Camellia Place
- 4636 Camellia Place
- 4628 Camellia Place
- 4633 Magnolia Place
- 4628 Camellia Place
- 4635 Magnolia Place
- 4631 Magnolia Place
- 4637 Magnolia Place
- 4638 Camellia Place
- 4639 Magnolia Place
- 4626 Camellia Place
- 4631 Camellia Place
- 4633 Camellia Place
- 4629 Camellia Place
- 4635 Camellia Place
- 4629 Magnolia Place
- 4640 Camellia Place