Estimated Value: $482,000 - $531,778
3
Beds
2
Baths
2,960
Sq Ft
$168/Sq Ft
Est. Value
About This Home
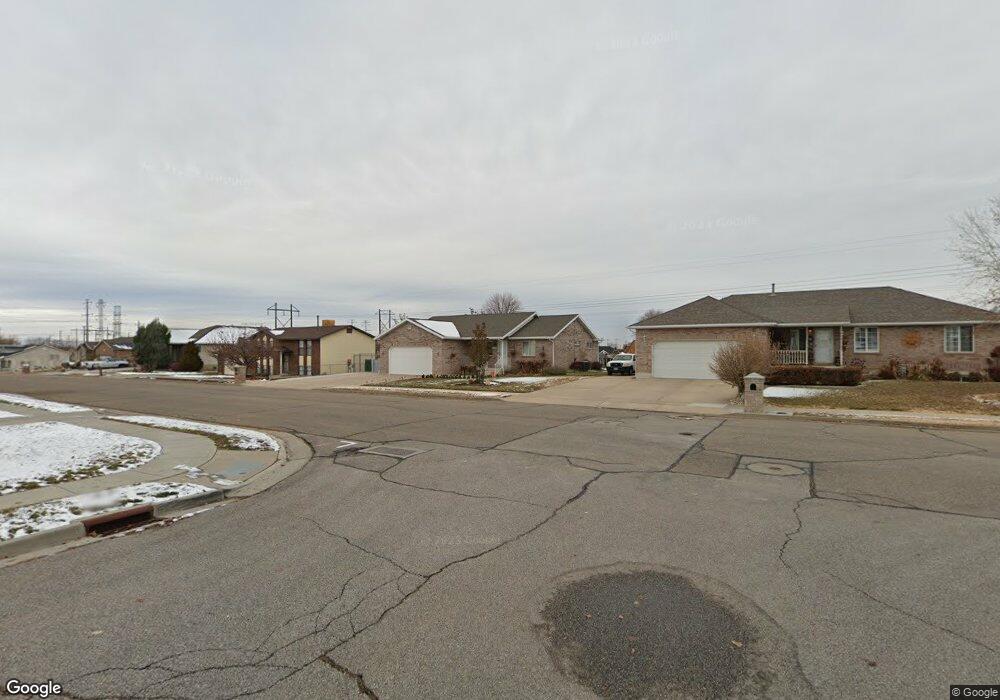
This home is located at 4632 S 3050 W, Roy, UT 84067 and is currently estimated at $496,445, approximately $167 per square foot. 4632 S 3050 W is a home located in Weber County with nearby schools including Midland School, Sand Ridge Junior High School, and Roy High School.
Ownership History
Date
Name
Owned For
Owner Type
Purchase Details
Closed on
Jul 23, 2024
Sold by
Chavez David Scott
Bought by
Chavez David Scott and Chavez Julie M
Current Estimated Value
Home Financials for this Owner
Home Financials are based on the most recent Mortgage that was taken out on this home.
Original Mortgage
$436,000
Outstanding Balance
$430,752
Interest Rate
6.95%
Mortgage Type
New Conventional
Estimated Equity
$65,693
Purchase Details
Closed on
May 18, 2016
Bought by
Chavez David Scott
Home Financials for this Owner
Home Financials are based on the most recent Mortgage that was taken out on this home.
Original Mortgage
$256,918
Interest Rate
3.57%
Purchase Details
Closed on
Aug 10, 2012
Sold by
Thompson Dannie R
Bought by
Thompson Amber D
Purchase Details
Closed on
Oct 20, 2009
Sold by
Thompson Amber D
Bought by
Thompson Amber D and Thompson Dannie R
Home Financials for this Owner
Home Financials are based on the most recent Mortgage that was taken out on this home.
Original Mortgage
$244,523
Interest Rate
5.05%
Mortgage Type
FHA
Purchase Details
Closed on
Sep 25, 2008
Sold by
Thompson Amber D
Bought by
Thompson Amber D and Thompson Dannie R
Home Financials for this Owner
Home Financials are based on the most recent Mortgage that was taken out on this home.
Original Mortgage
$240,910
Interest Rate
6.49%
Mortgage Type
New Conventional
Purchase Details
Closed on
Oct 16, 2007
Sold by
Hoggan Brett D and Hoggan Kamie
Bought by
Reeder Amber D
Home Financials for this Owner
Home Financials are based on the most recent Mortgage that was taken out on this home.
Original Mortgage
$238,525
Interest Rate
6.42%
Mortgage Type
FHA
Purchase Details
Closed on
May 26, 2005
Sold by
Rockhard Construction Inc
Bought by
Hoggan Brett D and Hoggan Kamie
Home Financials for this Owner
Home Financials are based on the most recent Mortgage that was taken out on this home.
Original Mortgage
$175,221
Interest Rate
5.84%
Mortgage Type
FHA
Purchase Details
Closed on
Dec 3, 2004
Sold by
Fuller Carol Ann J and Kay Rockie J
Bought by
Rockhard Construction Inc
Purchase Details
Closed on
Jul 14, 2004
Sold by
Kay Rockie J and Kay Jared A
Bought by
Fuller Carol Ann J
Purchase Details
Closed on
Jun 10, 2004
Sold by
Kay Rockie John and Kay Jared A
Bought by
Rockhard Construction Llc and Kay Rockie J
Create a Home Valuation Report for This Property
The Home Valuation Report is an in-depth analysis detailing your home's value as well as a comparison with similar homes in the area
Home Values in the Area
Average Home Value in this Area
Purchase History
| Date | Buyer | Sale Price | Title Company |
|---|---|---|---|
| Chavez David Scott | -- | Old Republic Title | |
| Chavez David Scott | -- | Old Republic Title | |
| Chavez David Scott | -- | -- | |
| Thompson Amber D | -- | None Available | |
| Thompson Amber D | -- | Accommodation | |
| Thompson Amber D | -- | Backman Ntp | |
| Thompson Amber D | -- | Accommodation | |
| Thompson Amber D | -- | Backman | |
| Reeder Amber D | -- | Backman | |
| Hoggan Brett D | -- | Backman | |
| Rockhard Construction Inc | -- | Bonneville Title Company Cle | |
| Fuller Carol Ann J | -- | First American Title | |
| Kay Rockie J | -- | First American Title | |
| Rockhard Construction Llc | -- | First American Title |
Source: Public Records
Mortgage History
| Date | Status | Borrower | Loan Amount |
|---|---|---|---|
| Open | Chavez David Scott | $436,000 | |
| Previous Owner | Chavez David Scott | $256,918 | |
| Previous Owner | Chavez David Scott | -- | |
| Previous Owner | Thompson Amber D | $244,523 | |
| Previous Owner | Thompson Amber D | $240,910 | |
| Previous Owner | Reeder Amber D | $238,525 | |
| Previous Owner | Hoggan Brett D | $175,221 |
Source: Public Records
Tax History Compared to Growth
Tax History
| Year | Tax Paid | Tax Assessment Tax Assessment Total Assessment is a certain percentage of the fair market value that is determined by local assessors to be the total taxable value of land and additions on the property. | Land | Improvement |
|---|---|---|---|---|
| 2025 | $3,256 | $526,394 | $140,000 | $386,394 |
| 2024 | $3,175 | $284,349 | $77,016 | $207,333 |
| 2023 | $2,802 | $249,150 | $71,441 | $177,709 |
| 2022 | $3,065 | $282,150 | $60,504 | $221,646 |
| 2021 | $2,646 | $402,000 | $85,012 | $316,988 |
| 2020 | $2,442 | $340,000 | $85,012 | $254,988 |
| 2019 | $2,378 | $312,000 | $54,908 | $257,092 |
| 2018 | $2,414 | $300,000 | $54,908 | $245,092 |
| 2017 | $2,408 | $282,000 | $54,908 | $227,092 |
| 2016 | $2,235 | $140,353 | $30,199 | $110,154 |
| 2015 | $1,963 | $125,626 | $30,199 | $95,427 |
| 2014 | $1,777 | $111,355 | $30,199 | $81,156 |
Source: Public Records
Map
Nearby Homes
- 4635 S 2950 W
- 3014 W 4750 S
- 3046 W 4850 S
- 3084 W 4375 S
- 4891 S 2875 W
- 4440 Stone Creek Rd Unit 2E
- 4510 Stone Creek Rd Unit F
- 4918 S 2925 W
- 2979 W 4275 S
- 2816 W 4400 S
- 4491 Haven Creek Rd Unit A
- 2802 W 4375 S
- 5009 S 2925 W
- 5003 S 2825 W
- 4875 S 2675 W
- 3434 W 4525 S
- 2835 W 4200 S
- 4919 S 2675 W
- 4317 S 3350 W
- 5063 S 2825 W
- 4616 S 3050 W
- 4616 S 3050 W Unit 47
- 3046 W 4650 S
- 3034 W 4650 S
- 4631 S 3050 W
- 4633 S 3025 W
- 4617 S 3025 W
- 3052 W 4650 S
- 3028 W 4650 S
- 3028 W 4650 S Unit LOT 15
- 3049 W 4600 S
- 4615 S 3050 W
- 4615 S 3050 W Unit 50
- 3027 W 4600 S
- 3064 W 4650 S
- 3069 W 4600 S
- 4605 S 3050 W
- 3047 W 4650 S
- 3035 W 4650 S
- 4634 S 3025 W