Estimated Value: $386,000 - $412,459
4
Beds
2
Baths
1,920
Sq Ft
$208/Sq Ft
Est. Value
About This Home
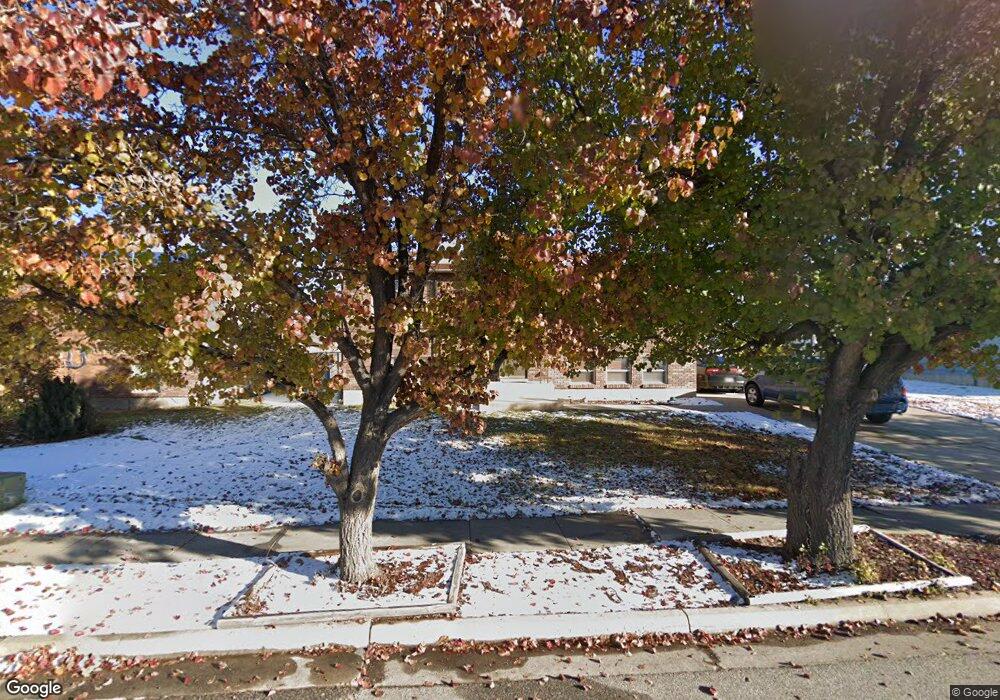
This home is located at 4632 S 3800 W, Roy, UT 84067 and is currently estimated at $399,865, approximately $208 per square foot. 4632 S 3800 W is a home located in Weber County with nearby schools including West Haven School, Sand Ridge Junior High School, and Roy High School.
Ownership History
Date
Name
Owned For
Owner Type
Purchase Details
Closed on
Jun 21, 2017
Sold by
Judkins Justin R and Ward Mckenzie L
Bought by
Parker Skyler and Fain Chantel
Current Estimated Value
Home Financials for this Owner
Home Financials are based on the most recent Mortgage that was taken out on this home.
Original Mortgage
$201,286
Outstanding Balance
$166,175
Interest Rate
3.75%
Mortgage Type
FHA
Estimated Equity
$233,690
Purchase Details
Closed on
Aug 7, 2014
Sold by
Mctee Nathan and Mctee Heather
Bought by
Judkins Justin R and Ward Mckenzie L
Home Financials for this Owner
Home Financials are based on the most recent Mortgage that was taken out on this home.
Original Mortgage
$8,500
Interest Rate
4.12%
Mortgage Type
Stand Alone Second
Purchase Details
Closed on
Oct 15, 2004
Sold by
Critchlow Cindy
Bought by
Draper Rockland
Purchase Details
Closed on
Nov 19, 1996
Sold by
Read Cindy L
Bought by
Critchlow Cindy
Create a Home Valuation Report for This Property
The Home Valuation Report is an in-depth analysis detailing your home's value as well as a comparison with similar homes in the area
Home Values in the Area
Average Home Value in this Area
Purchase History
| Date | Buyer | Sale Price | Title Company |
|---|---|---|---|
| Parker Skyler | -- | American Secure Title Tremon | |
| Judkins Justin R | -- | Backman Title Services Ltd | |
| Draper Rockland | -- | -- | |
| Critchlow Cindy | -- | -- |
Source: Public Records
Mortgage History
| Date | Status | Borrower | Loan Amount |
|---|---|---|---|
| Open | Parker Skyler | $201,286 | |
| Previous Owner | Judkins Justin R | $8,500 |
Source: Public Records
Tax History Compared to Growth
Tax History
| Year | Tax Paid | Tax Assessment Tax Assessment Total Assessment is a certain percentage of the fair market value that is determined by local assessors to be the total taxable value of land and additions on the property. | Land | Improvement |
|---|---|---|---|---|
| 2025 | $2,351 | $367,914 | $125,458 | $242,456 |
| 2024 | $2,296 | $199,099 | $69,001 | $130,098 |
| 2023 | $2,296 | $200,200 | $56,381 | $143,819 |
| 2022 | $2,319 | $208,450 | $55,098 | $153,352 |
| 2021 | $1,810 | $265,000 | $71,205 | $193,795 |
| 2020 | $1,716 | $231,000 | $71,205 | $159,795 |
| 2019 | $1,673 | $212,000 | $44,129 | $167,871 |
| 2018 | $1,685 | $202,000 | $39,978 | $162,022 |
| 2017 | $1,509 | $168,000 | $39,978 | $128,022 |
| 2016 | $1,452 | $86,793 | $20,945 | $65,848 |
| 2015 | $1,262 | $76,692 | $20,945 | $55,747 |
| 2014 | $1,170 | $69,485 | $20,945 | $48,540 |
Source: Public Records
Map
Nearby Homes
- 3692 W 4625 S
- 3669 W 4625 S
- 3671 W 4700 S
- 3652 W 4625 S
- 3632 W 4650 S
- 3627 W 4650 S
- Villages Townhome Plan at Green Farm - Villages
- 4024 W 4650 S
- 3610 W 4475 S
- Poplar Plan at Highgate Cove
- Pando Plan at Highgate Cove
- 4094 W 4700 S
- 3524 W 4835 S Unit 22
- 3523 W 4835 S Unit 28
- 4097 W 4750 S
- 3820 Foxglen Dr
- 3434 W 4525 S
- 3509 W 4835 S Unit 26
- 4890 S 4075 W
- 4106 W 4875 S