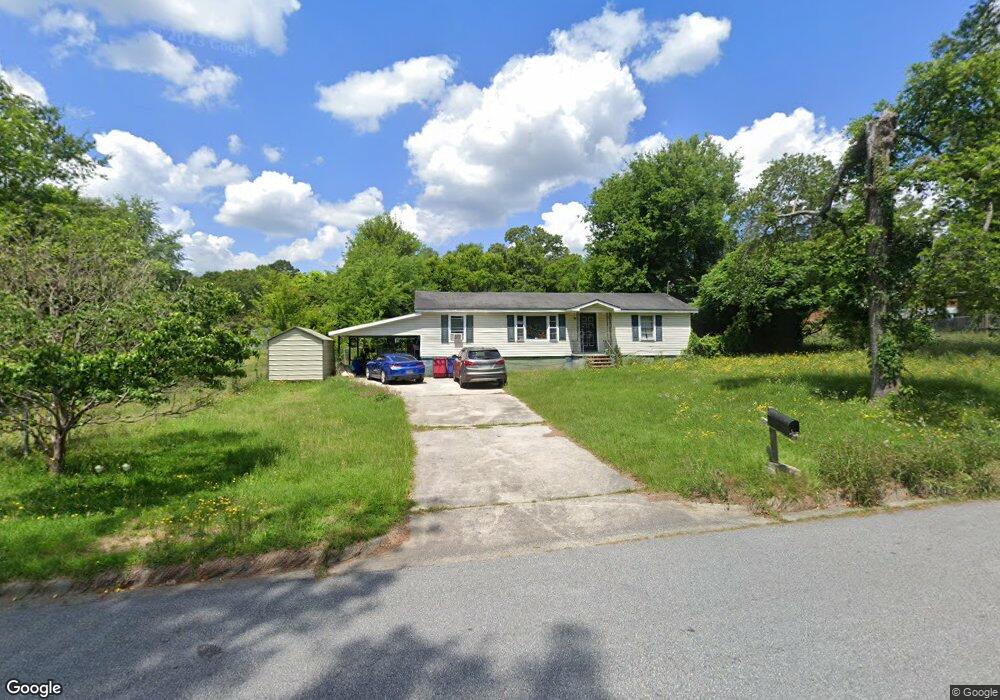
4635 Bishop Rd Macon, GA 31206
Estimated Value: $111,219 - $146,000
2
Beds
1
Bath
1,272
Sq Ft
$96/Sq Ft
Est. Value
About This Home
This home is located at 4635 Bishop Rd, Macon, GA 31206 and is currently estimated at $121,555, approximately $95 per square foot. 4635 Bishop Rd is a home located in Bibb County with nearby schools including Veterans Elementary School, Weaver Middle School, and Westside High School.
Ownership History
Date
Name
Owned For
Owner Type
Purchase Details
Closed on
Jul 13, 2025
Sold by
Alr Real Estate Llc
Bought by
Ngzg Llc
Current Estimated Value
Purchase Details
Closed on
Sep 11, 2024
Sold by
Tuvidoc Llc
Bought by
Alr Real Estate Llc
Purchase Details
Closed on
Nov 12, 2021
Sold by
Al & R Real Estate Llc
Bought by
Tuvidoc Llc
Purchase Details
Closed on
Oct 8, 2021
Sold by
Lish Investments Llc
Bought by
Alr Real Estate Llc
Purchase Details
Closed on
Oct 7, 2021
Sold by
Jp & Associates Homebuilders Llc
Bought by
Lish Investments Llc
Purchase Details
Closed on
Feb 14, 2020
Sold by
Estate Of Delcie Lawrence
Bought by
Chambley Timothy Michael and Chambley Julie
Purchase Details
Closed on
Nov 20, 2007
Sold by
Eversole Eddie C
Bought by
Jp & Associates Homebuilders Llc
Create a Home Valuation Report for This Property
The Home Valuation Report is an in-depth analysis detailing your home's value as well as a comparison with similar homes in the area
Purchase History
| Date | Buyer | Sale Price | Title Company |
|---|---|---|---|
| Ngzg Llc | $120,000 | None Listed On Document | |
| Ngzg Llc | $120,000 | None Listed On Document | |
| Alr Real Estate Llc | $220,000 | None Listed On Document | |
| Alr Real Estate Llc | $220,000 | None Listed On Document | |
| Tuvidoc Llc | $105,000 | None Available | |
| Alr Real Estate Llc | $350,000 | None Available | |
| Lish Investments Llc | $265,000 | None Available | |
| Chambley Timothy Michael | $40,000 | None Available | |
| Jp & Associates Homebuilders Llc | $60,000 | None Available |
Source: Public Records
Tax History
| Year | Tax Paid | Tax Assessment Tax Assessment Total Assessment is a certain percentage of the fair market value that is determined by local assessors to be the total taxable value of land and additions on the property. | Land | Improvement |
|---|---|---|---|---|
| 2025 | $784 | $31,909 | $3,696 | $28,213 |
| 2024 | $810 | $31,909 | $3,696 | $28,213 |
| 2023 | $684 | $26,931 | $3,360 | $23,571 |
| 2022 | $692 | $19,981 | $3,390 | $16,591 |
| 2021 | $591 | $15,564 | $3,291 | $12,273 |
| 2020 | $577 | $14,858 | $3,291 | $11,567 |
| 2019 | $582 | $14,858 | $3,291 | $11,567 |
| 2018 | $1,071 | $14,858 | $3,291 | $11,567 |
| 2017 | $565 | $15,084 | $5,192 | $9,892 |
| 2016 | $522 | $15,084 | $5,192 | $9,892 |
| 2015 | $739 | $15,084 | $5,192 | $9,892 |
| 2014 | $740 | $15,084 | $5,192 | $9,892 |
Source: Public Records
Map
Nearby Homes
- 4527 Wilson Rd
- 4506 Ebenezer Church Rd
- 4941 Log Cabin Dr
- 4158 Log Cabin Dr
- 4500 Chambers Rd
- 4064 W Oak Dr
- 4141 Briarwood Dr
- 3862 Gadson Dr
- 4742 Bloomfield Rd
- 3818 Stacy Dr
- 3764 Walker Ave
- 3724 Johnson Ave W
- 1588 N Atwood Dr
- 1467 New Castle Dr
- 5441 Columbus Rd
- 1508 N Atwood Dr
- 5060 Pinefield Dr
- 3120 Bloomfield Dr
- 3842 Wynnwood Dr
- 165 Camden Trace
Your Personal Tour Guide
Ask me questions while you tour the home.