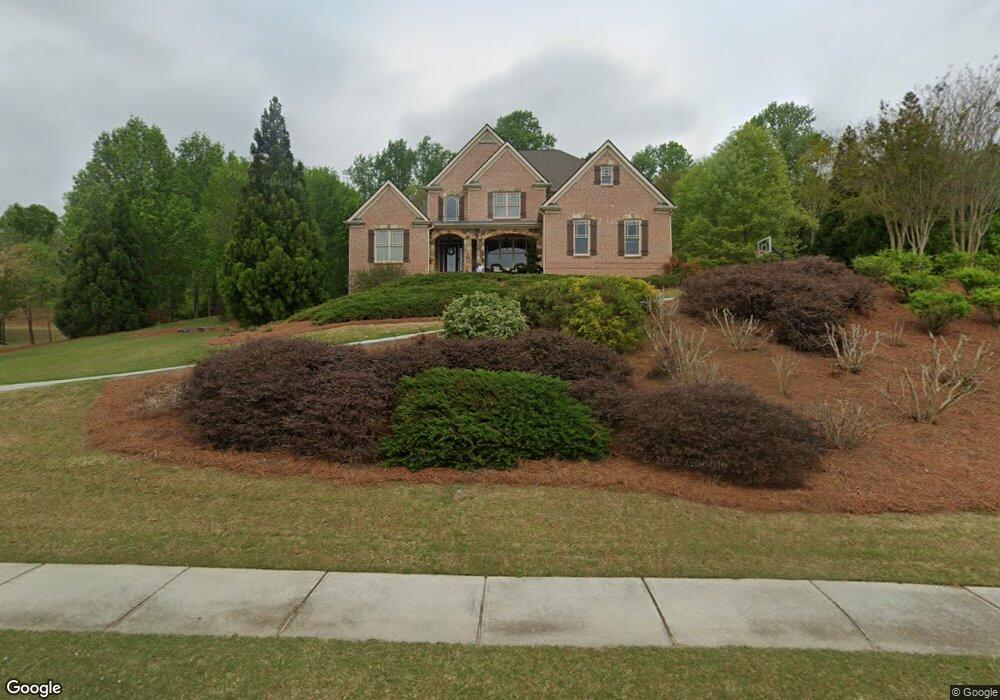
4635 Cardinal Ridge Way Flowery Branch, GA 30542
Estimated Value: $791,000 - $1,021,000
4
Beds
4
Baths
3,981
Sq Ft
$231/Sq Ft
Est. Value
About This Home
This home is located at 4635 Cardinal Ridge Way, Flowery Branch, GA 30542 and is currently estimated at $919,643, approximately $231 per square foot. 4635 Cardinal Ridge Way is a home located in Hall County with nearby schools including Martin Elementary School, Southwest Middle School, and C.W. Davis Middle School.
Ownership History
Date
Name
Owned For
Owner Type
Purchase Details
Closed on
Jan 24, 2020
Sold by
Muck Joseph H
Bought by
Muck Joseph H and Muck Suzanne M
Current Estimated Value
Home Financials for this Owner
Home Financials are based on the most recent Mortgage that was taken out on this home.
Original Mortgage
$214,000
Outstanding Balance
$147,933
Interest Rate
3.74%
Mortgage Type
New Conventional
Estimated Equity
$771,710
Purchase Details
Closed on
Feb 3, 2015
Sold by
Muck Joseph H
Bought by
Muck Joseph H
Home Financials for this Owner
Home Financials are based on the most recent Mortgage that was taken out on this home.
Original Mortgage
$50,000
Interest Rate
3.81%
Mortgage Type
New Conventional
Purchase Details
Closed on
Nov 17, 2008
Sold by
Bryan Mill Builders Llc
Bought by
Muck Joseph H and Muck Ashley C
Home Financials for this Owner
Home Financials are based on the most recent Mortgage that was taken out on this home.
Original Mortgage
$360,000
Interest Rate
5.89%
Mortgage Type
New Conventional
Purchase Details
Closed on
Nov 15, 2005
Sold by
Ruby-Forrest Ltd
Bought by
Bryan Mill Builders Llc
Create a Home Valuation Report for This Property
The Home Valuation Report is an in-depth analysis detailing your home's value as well as a comparison with similar homes in the area
Home Values in the Area
Average Home Value in this Area
Purchase History
| Date | Buyer | Sale Price | Title Company |
|---|---|---|---|
| Muck Joseph H | -- | -- | |
| Muck Joseph H | -- | -- | |
| Muck Joseph H | $517,800 | -- | |
| Bryan Mill Builders Llc | $800,000 | -- |
Source: Public Records
Mortgage History
| Date | Status | Borrower | Loan Amount |
|---|---|---|---|
| Open | Muck Joseph H | $214,000 | |
| Previous Owner | Muck Joseph H | $50,000 | |
| Previous Owner | Muck Joseph H | $360,000 |
Source: Public Records
Tax History Compared to Growth
Tax History
| Year | Tax Paid | Tax Assessment Tax Assessment Total Assessment is a certain percentage of the fair market value that is determined by local assessors to be the total taxable value of land and additions on the property. | Land | Improvement |
|---|---|---|---|---|
| 2024 | $8,689 | $344,560 | $68,880 | $275,680 |
| 2023 | $7,464 | $294,720 | $49,080 | $245,640 |
| 2022 | $6,995 | $264,640 | $45,680 | $218,960 |
| 2021 | $6,265 | $231,800 | $31,840 | $199,960 |
| 2020 | $6,527 | $234,800 | $22,560 | $212,240 |
| 2019 | $6,408 | $228,400 | $22,560 | $205,840 |
| 2018 | $6,319 | $218,440 | $26,920 | $191,520 |
| 2017 | $6,132 | $214,120 | $26,920 | $187,200 |
| 2016 | $5,549 | $198,080 | $10,880 | $187,200 |
| 2015 | $4,425 | $192,360 | $20,000 | $172,360 |
| 2014 | $4,425 | $155,560 | $11,680 | $143,880 |
Source: Public Records
Map
Nearby Homes
- 4711 Grandview Pkwy
- 4723 Grandview Pkwy
- 5059 Lancashire Ct
- 4621 Stanley Rd
- 4626 Deer Creek Ct
- 4860 Grandview Ct
- 4864 Grandview Ct
- 5021 Limerick Ln
- 4860 Wildlife Way
- 4826 Rose Heights Dr
- 5055 Pointer Ridge
- 5061 Pointer Ridge
- 5049 Holly Hock Dr
- 4947 Cash Rd
- 4580 J M Turk Rd
- 5129 Glen Forrest Dr
- 4715 Wilderness Trail
- 4631 Cardinal Ridge Way Unit 145
- 4639 Cardinal Ridge Way
- 4632 Cardinal Ridge Way
- 4638 Cardinal Ridge Way
- 4645 Cardinal Ridge Way
- 4627 Cardinal Ridge Way
- 4646 Cardinal Ridge Way
- 4628 Cardinal Ridge Way
- 4628 Cardinal Ridge Way Unit 1
- 4628 Cardinal Ridge Way
- 4596 J M Turk Rd
- 4596 J M Turk Rd
- 4596 J M Turk Rd
- 4596 J M Turk Rd
- 4596 J M Turk Rd
- 0 Vista Ridge Ln Unit 77 2845985
- 000 Vista Ridge Ln
- 0 Vista Ridge Ln
- 0 Vista Ridge Ln Unit 3082493
- 0 Vista Ridge Ln Unit 8063937