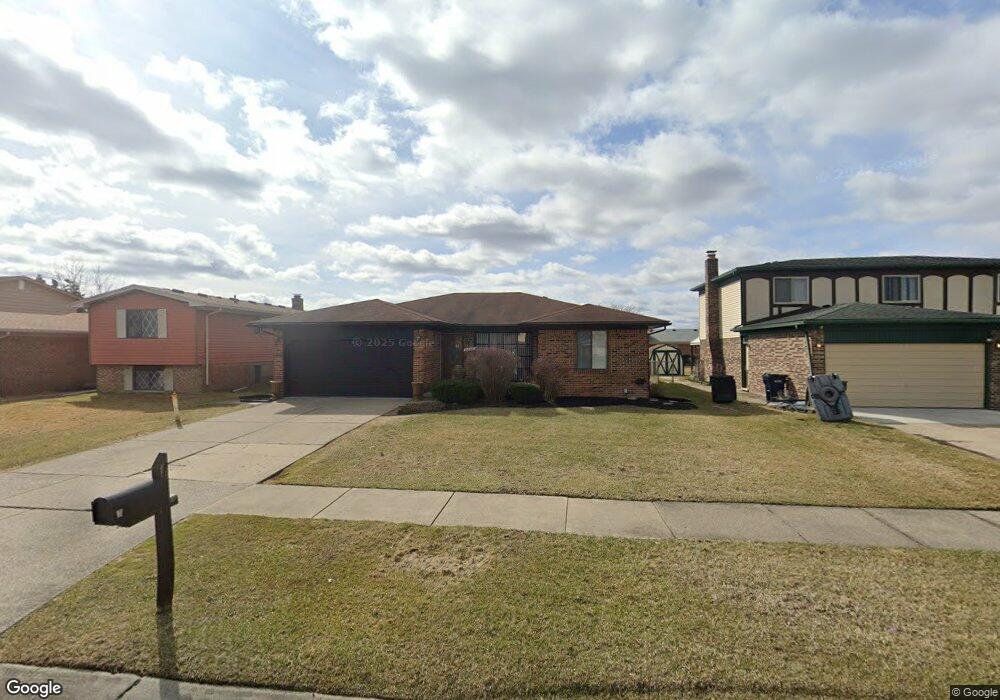
4636 Boulder Dr Sterling Heights, MI 48310
Estimated Value: $342,000 - $370,000
3
Beds
3
Baths
1,608
Sq Ft
$220/Sq Ft
Est. Value
About This Home
This home is located at 4636 Boulder Dr, Sterling Heights, MI 48310 and is currently estimated at $353,673, approximately $219 per square foot. 4636 Boulder Dr is a home located in Macomb County with nearby schools including Jefferson Elementary School, Grissom Middle School, and Sterling Heights Senior H.S..
Ownership History
Date
Name
Owned For
Owner Type
Purchase Details
Closed on
Jun 6, 2020
Sold by
Garza Derric and Garza Joanne
Bought by
Yatoma Andrew
Current Estimated Value
Home Financials for this Owner
Home Financials are based on the most recent Mortgage that was taken out on this home.
Original Mortgage
$203,775
Interest Rate
3.1%
Mortgage Type
New Conventional
Purchase Details
Closed on
Dec 10, 2016
Sold by
Garza Joanne
Bought by
Garza Derric and Garza Joanne
Purchase Details
Closed on
May 7, 2009
Sold by
Garza Derric D and Garza Joanne
Bought by
Garza Joanne
Purchase Details
Closed on
Jan 25, 2007
Sold by
Birr Norman J and Birr Karen L
Bought by
Garza Derric D and Garza Joanne L
Home Financials for this Owner
Home Financials are based on the most recent Mortgage that was taken out on this home.
Original Mortgage
$148,350
Interest Rate
6.99%
Mortgage Type
Stand Alone First
Create a Home Valuation Report for This Property
The Home Valuation Report is an in-depth analysis detailing your home's value as well as a comparison with similar homes in the area
Home Values in the Area
Average Home Value in this Area
Purchase History
| Date | Buyer | Sale Price | Title Company |
|---|---|---|---|
| Yatoma Andrew | $214,500 | Amrock | |
| Garza Derric | -- | None Available | |
| Garza Joanne | -- | None Available | |
| Garza Derric D | $185,450 | Homeowners Title Agency |
Source: Public Records
Mortgage History
| Date | Status | Borrower | Loan Amount |
|---|---|---|---|
| Previous Owner | Yatoma Andrew | $203,775 | |
| Previous Owner | Garza Derric D | $148,350 |
Source: Public Records
Tax History Compared to Growth
Tax History
| Year | Tax Paid | Tax Assessment Tax Assessment Total Assessment is a certain percentage of the fair market value that is determined by local assessors to be the total taxable value of land and additions on the property. | Land | Improvement |
|---|---|---|---|---|
| 2025 | $5,695 | $162,900 | $0 | $0 |
| 2024 | $5,493 | $153,000 | $0 | $0 |
| 2023 | $5,214 | $137,700 | $0 | $0 |
| 2022 | $5,057 | $123,000 | $0 | $0 |
| 2021 | $5,227 | $116,200 | $0 | $0 |
| 2020 | $3,224 | $111,600 | $0 | $0 |
| 2019 | $3,848 | $105,300 | $0 | $0 |
| 2018 | $4,948 | $96,900 | $0 | $0 |
| 2017 | $3,671 | $90,100 | $13,500 | $76,600 |
| 2016 | $3,848 | $90,100 | $0 | $0 |
| 2015 | -- | $82,500 | $0 | $0 |
| 2014 | -- | $69,300 | $0 | $0 |
Source: Public Records
Map
Nearby Homes
- 4622 Ardmore Dr
- 38576 Cottonwood Dr
- 4653 Lucerne Dr
- 38915 Claremont Ct
- 4761 Fox Hill Dr
- 4325 Fox Hill Dr
- 38338 Coronation Dr
- 38638 Harrison Dr
- 38172 Yonkers Dr
- 4768 Dreon Ct
- 38968 Harrison Dr
- 3816 Pokley Ct
- 5118 Fredrick Dr
- 5477 Victory Cir Unit 70
- 37683 Adrian Dr
- 3600 Brandi Dr
- 3349 Dobbin Dr
- 37288 Vernon Dr
- 3601 Denson Dr
- 37258 Carpathia Blvd
- 4648 Boulder Dr
- 4624 Boulder Dr
- 4660 Boulder Dr
- 4635 Ardmore Dr
- 4612 Boulder Dr
- 4623 Ardmore Dr
- 4647 Ardmore Dr
- 4611 Ardmore Dr
- 4659 Ardmore Dr
- 4672 Boulder Dr
- 4637 Boulder Dr
- 4488 Boulder Dr
- 4649 Boulder Dr
- 4625 Boulder Dr
- 4493 Ardmore Dr
- 4613 Boulder Dr
- 4661 Boulder Dr
- 4671 Ardmore Dr
- 4684 Boulder Dr
- 4476 Boulder Dr