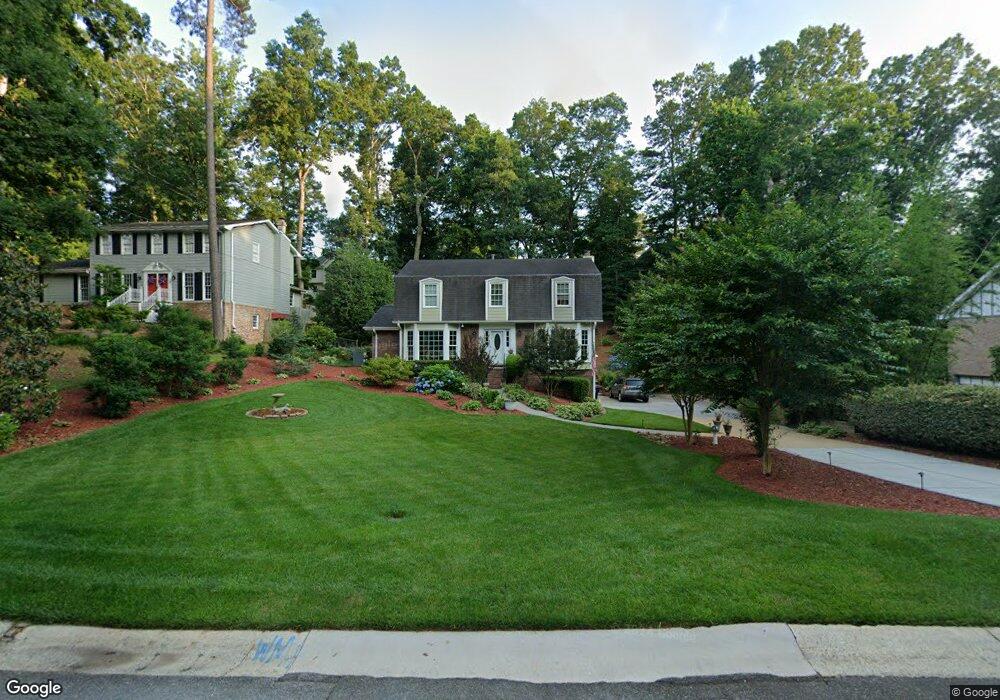
4636 Mountain Creek Dr NE Unit 3 Roswell, GA 30075
East Cobb NeighborhoodEstimated Value: $564,000 - $596,141
3
Beds
3
Baths
2,252
Sq Ft
$261/Sq Ft
Est. Value
About This Home
This home is located at 4636 Mountain Creek Dr NE Unit 3, Roswell, GA 30075 and is currently estimated at $587,785, approximately $261 per square foot. 4636 Mountain Creek Dr NE Unit 3 is a home located in Cobb County with nearby schools including Tritt Elementary School, Hightower Trail Middle School, and Pope High School.
Ownership History
Date
Name
Owned For
Owner Type
Purchase Details
Closed on
Sep 2, 2025
Sold by
Krogel Philip Richard and Krogel Carlene D
Bought by
Philip And Carlene Krogel Revocable Trust and Krogel
Current Estimated Value
Purchase Details
Closed on
Nov 12, 1999
Sold by
Sowers Charles M and Sowers Theresa L
Bought by
Krogel Philip Richard and Krogel Carlene D
Home Financials for this Owner
Home Financials are based on the most recent Mortgage that was taken out on this home.
Original Mortgage
$165,490
Interest Rate
7.7%
Mortgage Type
New Conventional
Purchase Details
Closed on
Oct 17, 1997
Sold by
Lemay David A and Lemay Jennifer
Bought by
Sowers Charles M and Sowers Theresa
Home Financials for this Owner
Home Financials are based on the most recent Mortgage that was taken out on this home.
Original Mortgage
$125,900
Interest Rate
7.55%
Mortgage Type
New Conventional
Create a Home Valuation Report for This Property
The Home Valuation Report is an in-depth analysis detailing your home's value as well as a comparison with similar homes in the area
Home Values in the Area
Average Home Value in this Area
Purchase History
| Date | Buyer | Sale Price | Title Company |
|---|---|---|---|
| Philip And Carlene Krogel Revocable Trust | -- | None Listed On Document | |
| Krogel Philip Richard | $174,200 | -- | |
| Sowers Charles M | $139,900 | -- |
Source: Public Records
Mortgage History
| Date | Status | Borrower | Loan Amount |
|---|---|---|---|
| Previous Owner | Krogel Philip Richard | $165,490 | |
| Previous Owner | Sowers Charles M | $125,900 |
Source: Public Records
Tax History Compared to Growth
Tax History
| Year | Tax Paid | Tax Assessment Tax Assessment Total Assessment is a certain percentage of the fair market value that is determined by local assessors to be the total taxable value of land and additions on the property. | Land | Improvement |
|---|---|---|---|---|
| 2025 | $984 | $194,504 | $48,000 | $146,504 |
| 2024 | $988 | $194,504 | $48,000 | $146,504 |
| 2023 | $793 | $198,164 | $44,000 | $154,164 |
| 2022 | $898 | $164,392 | $35,200 | $129,192 |
| 2021 | $809 | $134,644 | $35,200 | $99,444 |
| 2020 | $809 | $134,644 | $35,200 | $99,444 |
| 2019 | $809 | $134,644 | $35,200 | $99,444 |
| 2018 | $732 | $108,704 | $30,000 | $78,704 |
| 2017 | $661 | $108,704 | $30,000 | $78,704 |
| 2016 | $2,407 | $103,012 | $30,000 | $73,012 |
| 2015 | $2,069 | $85,748 | $24,000 | $61,748 |
| 2014 | $2,083 | $85,748 | $0 | $0 |
Source: Public Records
Map
Nearby Homes
- 4574 Woodland Cir NE
- 3025 Creek Ct NE
- 4486 Huffman Dr NE
- 4448 Huffman Dr NE
- 4618 Shallowford Rd
- 3226 Artessa Ln NE
- 3231 Artessa Ln NE
- 3277 Artessa Ln NE
- 2990 Mountain Trace NE
- 2993 Byrons Green Ct
- 4290 Freeman Rd
- 2821 Interlaken Dr
- 2997 Gateland Square
- 3333 Trails End Rd NE
- 2859 Tynewick Dr NE
- 3402 Johnson Ferry Rd NE
- 16 Alicia Ct
- 3453 Drayton Dr NE
- 4634 Mountain Creek Dr NE
- 4638 Mountain Creek Dr NE
- 4638 Mountain Creek Dr NE Unit 39
- 2883 Clary Hill Dr NE
- 2881 Clary Hill Dr NE
- 4632 Mountain Creek Dr NE
- 4640 Mountain Creek Dr NE
- 2885 Clary Hill Dr NE
- 2879 Clary Hill Dr NE
- 4635 Mountain Creek Dr NE
- 4639 Mountain Creek Dr NE Unit 3
- 2887 Clary Hill Dr NE
- 4637 Mountain Creek Dr NE Unit 3
- 4642 Mountain Creek Dr NE
- 4633 Mountain Creek Dr NE
- 4641 Mountain Creek Dr NE
- 2877 Clary Hill Dr NE
- 2990 Clary Hill Place NE
- 4631 Mountain Creek Dr NE
- 2999 Clary Hill Ct NE