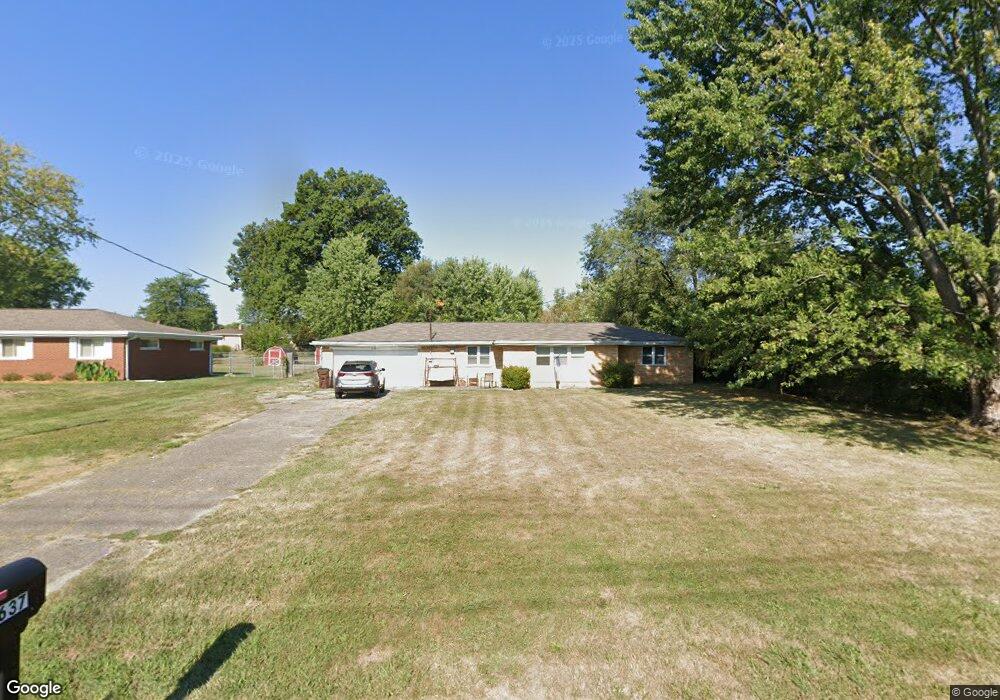
4637 Rumpke Rd Cincinnati, OH 45245
Estimated Value: $210,778 - $343,000
2
Beds
1
Bath
1,188
Sq Ft
$223/Sq Ft
Est. Value
About This Home
This home is located at 4637 Rumpke Rd, Cincinnati, OH 45245 and is currently estimated at $265,195, approximately $223 per square foot. 4637 Rumpke Rd is a home located in Clermont County with nearby schools including Summerside Elementary School, West Clermont Middle School, and West Clermont High School.
Ownership History
Date
Name
Owned For
Owner Type
Purchase Details
Closed on
Mar 16, 2009
Sold by
Ahern James K and Ahern Melanie
Bought by
Stonelick Properties Llc
Current Estimated Value
Purchase Details
Closed on
Jun 14, 2006
Sold by
Cottingham Rhonda
Bought by
Ahern James K
Home Financials for this Owner
Home Financials are based on the most recent Mortgage that was taken out on this home.
Original Mortgage
$93,150
Interest Rate
6.85%
Mortgage Type
Purchase Money Mortgage
Purchase Details
Closed on
Aug 20, 2004
Sold by
Turner Edward R and Turner Brenda F
Bought by
Cottingham James and Cottingham Rhonda
Home Financials for this Owner
Home Financials are based on the most recent Mortgage that was taken out on this home.
Original Mortgage
$115,000
Interest Rate
6.08%
Mortgage Type
Purchase Money Mortgage
Purchase Details
Closed on
Oct 1, 1987
Create a Home Valuation Report for This Property
The Home Valuation Report is an in-depth analysis detailing your home's value as well as a comparison with similar homes in the area
Purchase History
| Date | Buyer | Sale Price | Title Company |
|---|---|---|---|
| Stonelick Properties Llc | -- | None Available | |
| Ahern James K | $91,000 | None Available | |
| Cottingham James | $127,000 | -- | |
| -- | $60,900 | -- |
Source: Public Records
Mortgage History
| Date | Status | Borrower | Loan Amount |
|---|---|---|---|
| Previous Owner | Ahern James K | $93,150 | |
| Previous Owner | Cottingham James | $115,000 |
Source: Public Records
Tax History
| Year | Tax Paid | Tax Assessment Tax Assessment Total Assessment is a certain percentage of the fair market value that is determined by local assessors to be the total taxable value of land and additions on the property. | Land | Improvement |
|---|---|---|---|---|
| 2024 | $2,318 | $44,910 | $11,410 | $33,500 |
| 2023 | $2,321 | $44,910 | $11,410 | $33,500 |
| 2022 | $2,138 | $35,880 | $9,100 | $26,780 |
| 2021 | $2,147 | $35,880 | $9,100 | $26,780 |
| 2020 | $2,149 | $35,880 | $9,100 | $26,780 |
| 2019 | $1,636 | $31,780 | $12,180 | $19,600 |
| 2018 | $1,652 | $31,780 | $12,180 | $19,600 |
| 2017 | $1,820 | $36,750 | $12,180 | $24,570 |
| 2016 | $1,820 | $31,680 | $10,500 | $21,180 |
| 2015 | $1,877 | $31,680 | $10,500 | $21,180 |
| 2014 | $1,877 | $33,640 | $10,500 | $23,140 |
| 2013 | $1,806 | $32,030 | $9,630 | $22,400 |
Source: Public Records
Map
Nearby Homes
- 4625 Locust Grove Ct
- 4633 Summerside Rd
- 4746 Shephard Rd
- 660 Barg Salt Run Rd
- 624 Fern Ct
- 1023 Glendale Dr
- 14 Tidewater Trace Unit 2207
- 4771 Klatte Rd
- 4565 Shephard Rd
- 11 Queens Creek Unit 2101
- 598 Dedication Ln
- 4583 Creekwood Ct
- 619 Charwood Dr
- 4427 Happiness Ln
- 1004 Crisfield Dr Unit 129
- 4588 Brittwood Ln
- 1236 Arapaho Ln
- 4493 Schoolhouse Rd
- 1079 Kensington Ln
- 4378 Terrace Dr