Estimated Value: $324,000 - $354,000
4
Beds
3
Baths
2,016
Sq Ft
$167/Sq Ft
Est. Value
About This Home
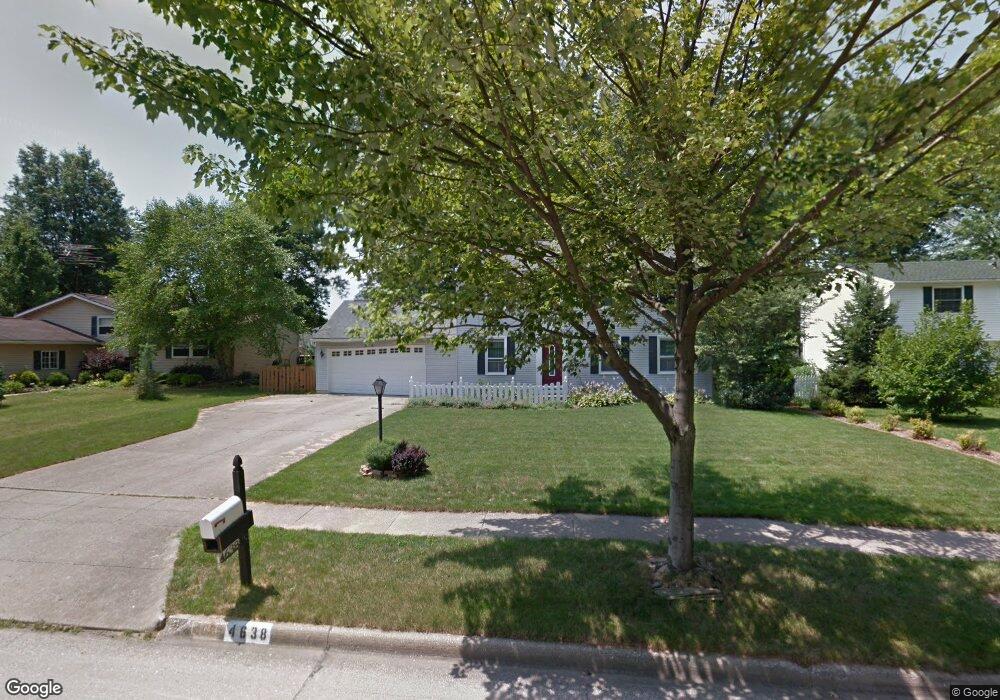
This home is located at 4638 Dresher Trail, Stow, OH 44224 and is currently estimated at $337,308, approximately $167 per square foot. 4638 Dresher Trail is a home located in Summit County with nearby schools including Stow-Munroe Falls High School, Primrose School of Hudson, and Holy Family Elementary School.
Ownership History
Date
Name
Owned For
Owner Type
Purchase Details
Closed on
Jun 17, 2025
Sold by
Rinehart Jeffrey S
Bought by
Benchmark Properties Of Ohio Ltd
Current Estimated Value
Home Financials for this Owner
Home Financials are based on the most recent Mortgage that was taken out on this home.
Original Mortgage
$318,200
Outstanding Balance
$317,375
Interest Rate
6.76%
Mortgage Type
Construction
Estimated Equity
$19,933
Purchase Details
Closed on
Oct 6, 2009
Sold by
Long Jonathan T and Long Donna J
Bought by
Rinehart Jeffrey S
Home Financials for this Owner
Home Financials are based on the most recent Mortgage that was taken out on this home.
Original Mortgage
$140,000
Interest Rate
5.19%
Mortgage Type
Purchase Money Mortgage
Purchase Details
Closed on
Jan 27, 2003
Sold by
Bish James R and Bish Derna L
Bought by
Long Jonathan T and Long Donna J
Home Financials for this Owner
Home Financials are based on the most recent Mortgage that was taken out on this home.
Original Mortgage
$137,600
Interest Rate
6.13%
Create a Home Valuation Report for This Property
The Home Valuation Report is an in-depth analysis detailing your home's value as well as a comparison with similar homes in the area
Home Values in the Area
Average Home Value in this Area
Purchase History
| Date | Buyer | Sale Price | Title Company |
|---|---|---|---|
| Benchmark Properties Of Ohio Ltd | $200,000 | None Listed On Document | |
| Rinehart Jeffrey S | $175,500 | Attorney | |
| Long Jonathan T | $172,000 | Multiple |
Source: Public Records
Mortgage History
| Date | Status | Borrower | Loan Amount |
|---|---|---|---|
| Open | Benchmark Properties Of Ohio Ltd | $318,200 | |
| Previous Owner | Rinehart Jeffrey S | $140,000 | |
| Previous Owner | Long Jonathan T | $137,600 |
Source: Public Records
Tax History Compared to Growth
Tax History
| Year | Tax Paid | Tax Assessment Tax Assessment Total Assessment is a certain percentage of the fair market value that is determined by local assessors to be the total taxable value of land and additions on the property. | Land | Improvement |
|---|---|---|---|---|
| 2025 | $7,421 | $89,502 | $14,518 | $74,984 |
| 2024 | $7,421 | $89,502 | $14,518 | $74,984 |
| 2023 | $7,421 | $89,502 | $14,518 | $74,984 |
| 2022 | $6,120 | $73,427 | $11,900 | $61,527 |
| 2021 | $4,474 | $73,427 | $11,900 | $61,527 |
| 2020 | $4,580 | $73,430 | $11,900 | $61,530 |
| 2019 | $4,245 | $59,180 | $11,660 | $47,520 |
| 2018 | $4,116 | $59,180 | $11,660 | $47,520 |
| 2017 | $3,526 | $59,180 | $11,660 | $47,520 |
| 2016 | $3,844 | $53,600 | $11,660 | $41,940 |
| 2015 | $3,526 | $53,600 | $11,660 | $41,940 |
| 2014 | $3,600 | $53,600 | $11,660 | $41,940 |
| 2013 | $3,798 | $55,720 | $11,660 | $44,060 |
Source: Public Records
Map
Nearby Homes
- 4621 Graford Ln
- 4901 Independence Cir Unit B
- 4917 Independence Cir Unit B
- 2418 Wrens Dr S Unit G
- 4903 Fishcreek Rd Unit 11B
- 2444 Port Charles Dr
- 2380 Port Williams Dr Unit 2380
- 4901 Pebblehurst Dr
- 0 Stow Rd Unit 5102979
- 4731 Haughton Ct
- 4227 Baird Rd
- 2327 Crockett Cir
- 4131 Burton Dr
- 2755 Laurel Woods Blvd
- 2140 Woodlawn Cir Unit 2144
- 3165 Peterboro Dr
- 4120 Klein Ave
- 2410 Liberty Rd
- 4451 Newcomer Rd
- 4035 Villas Dr
- 4630 Dresher Trail
- 4646 Dresher Trail
- 4627 Graford Ln
- 4622 Dresher Trail
- 4654 Dresher Trail
- 4635 Graford Ln
- 4639 Dresher Trail
- 4631 Dresher Trail
- 4643 Graford Ln
- 4647 Dresher Trail
- 4662 Dresher Trail
- 4614 Dresher Trail
- 4623 Dresher Trail
- 4472 Chatwood Dr
- 4655 Dresher Trail
- 4651 Graford Ln
- 4615 Dresher Trail
- 4672 Dresher Trail
- 4367 Foresthill Rd
- 4385 Foresthill Rd