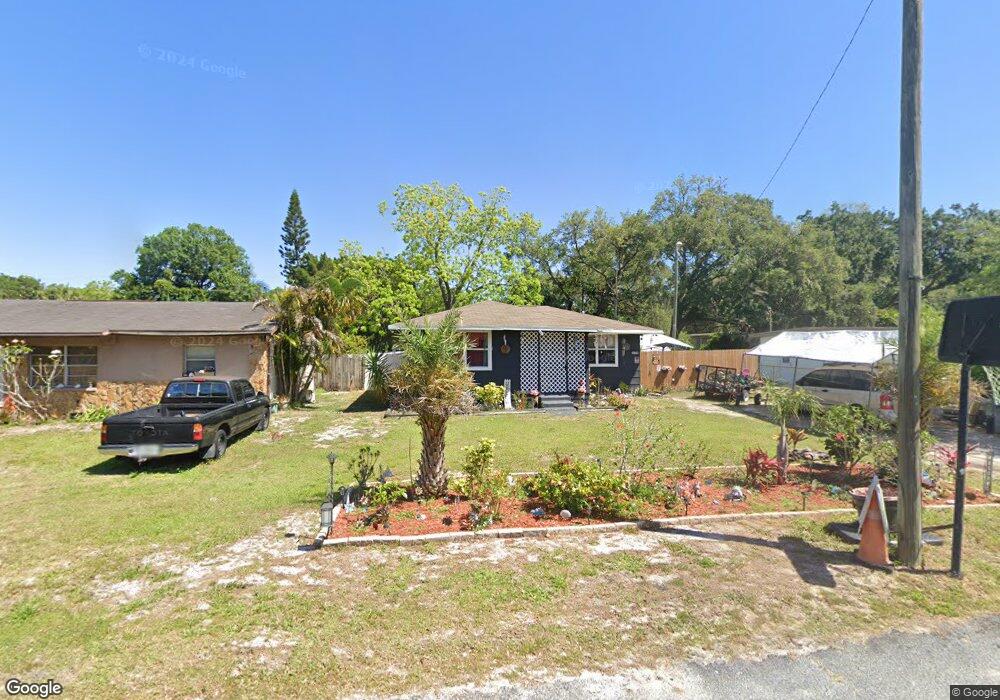
4639 Gazania St New Port Richey, FL 34652
South New Port Richey NeighborhoodEstimated Value: $99,000 - $147,990
2
Beds
1
Bath
760
Sq Ft
$170/Sq Ft
Est. Value
About This Home
This home is located at 4639 Gazania St, New Port Richey, FL 34652 and is currently estimated at $128,998, approximately $169 per square foot. 4639 Gazania St is a home located in Pasco County with nearby schools including Mittye P. Locke Elementary School, Gulf Trace Elementary School, and Paul R. Smith Middle School.
Ownership History
Date
Name
Owned For
Owner Type
Purchase Details
Closed on
Mar 22, 2018
Sold by
Visco Curt
Bought by
Visco Curt and Visco Mark
Current Estimated Value
Purchase Details
Closed on
Nov 16, 2015
Sold by
Littlejohn Bryan
Bought by
Visco Curt
Purchase Details
Closed on
Oct 23, 2015
Sold by
Graupman Wendy
Bought by
Littlejohn Bryan
Purchase Details
Closed on
May 26, 2006
Sold by
Sparacino Sam and Blum Lisa Ann
Bought by
Graupman Wendy
Home Financials for this Owner
Home Financials are based on the most recent Mortgage that was taken out on this home.
Original Mortgage
$84,000
Interest Rate
6.44%
Mortgage Type
Fannie Mae Freddie Mac
Purchase Details
Closed on
Mar 31, 2005
Sold by
Schlotter Joseph and Schlotter Yukiko
Bought by
Sparacino Sam
Home Financials for this Owner
Home Financials are based on the most recent Mortgage that was taken out on this home.
Original Mortgage
$82,316
Interest Rate
5.79%
Mortgage Type
FHA
Create a Home Valuation Report for This Property
The Home Valuation Report is an in-depth analysis detailing your home's value as well as a comparison with similar homes in the area
Home Values in the Area
Average Home Value in this Area
Purchase History
| Date | Buyer | Sale Price | Title Company |
|---|---|---|---|
| Visco Curt | -- | Attorney | |
| Visco Curt | $35,000 | Capstone Title Llc | |
| Littlejohn Bryan | $23,100 | None Available | |
| Graupman Wendy | $102,000 | Chelsea Title Suncoast Inc | |
| Sparacino Sam | $83,000 | Chelsea Title Of The Suncoas |
Source: Public Records
Mortgage History
| Date | Status | Borrower | Loan Amount |
|---|---|---|---|
| Previous Owner | Graupman Wendy | $84,000 | |
| Previous Owner | Sparacino Sam | $82,316 |
Source: Public Records
Tax History Compared to Growth
Tax History
| Year | Tax Paid | Tax Assessment Tax Assessment Total Assessment is a certain percentage of the fair market value that is determined by local assessors to be the total taxable value of land and additions on the property. | Land | Improvement |
|---|---|---|---|---|
| 2025 | $1,627 | $93,422 | $21,241 | $72,181 |
| 2024 | $1,627 | $102,603 | $21,241 | $81,362 |
| 2023 | $1,544 | $66,460 | $0 | $0 |
| 2022 | $1,206 | $74,505 | $12,781 | $61,724 |
| 2021 | $1,074 | $59,122 | $15,378 | $43,744 |
| 2020 | $1,013 | $58,034 | $15,378 | $42,656 |
| 2019 | $968 | $58,124 | $15,378 | $42,746 |
| 2018 | $862 | $47,796 | $12,378 | $35,418 |
| 2017 | $768 | $36,830 | $10,578 | $26,252 |
| 2016 | $724 | $36,120 | $10,578 | $25,542 |
| 2015 | $264 | $33,463 | $0 | $0 |
| 2014 | $247 | $34,220 | $10,578 | $23,642 |
Source: Public Records
Map
Nearby Homes
- 4709 Gazania St
- 4716 Gazania St
- 4713 Naftis Ln
- 4632 Salvia St
- 4602 Ontario Dr
- 4622 Paloverde Dr
- 4864 Shell Stream Blvd
- 4637 Cottonwood Dr
- 4617 Cottonwood Dr
- 4852 Shell Stream Blvd
- 4462 Rudder Way
- 4837 Rainbow Race
- 4479 Tucker Square
- 4845 Shell Stream Blvd
- 4707 Alma St
- 4505 Cottonwood Dr
- 4407 Tucker Square
- 4409 Tucker Square
- 4921 Shell Stream Blvd
- 4408 Sunstate Dr
- 4645 Gazania St
- 4633 Gazania St
- 4651 Gazania St
- 4638 Naftis Ln
- 4632 Naftis Ln
- 4627 Gazania St
- 4638 Gazania St
- 4652 Naftis Ln
- 4632 Gazania St
- 4705 Gazania St
- 4644 Gazania St
- 4650 Gazania St
- 4556 Needle Palm Dr
- 4704 Gazania St
- 4639 Naftis Ln
- 4715 Gazania St
- 4645 Naftis Ln
- 4633 Naftis Ln
- 4710 Gazania St
- 4623 Needle Palm Dr