Estimated Value: $359,000 - $396,000
4
Beds
2
Baths
1,764
Sq Ft
$214/Sq Ft
Est. Value
About This Home
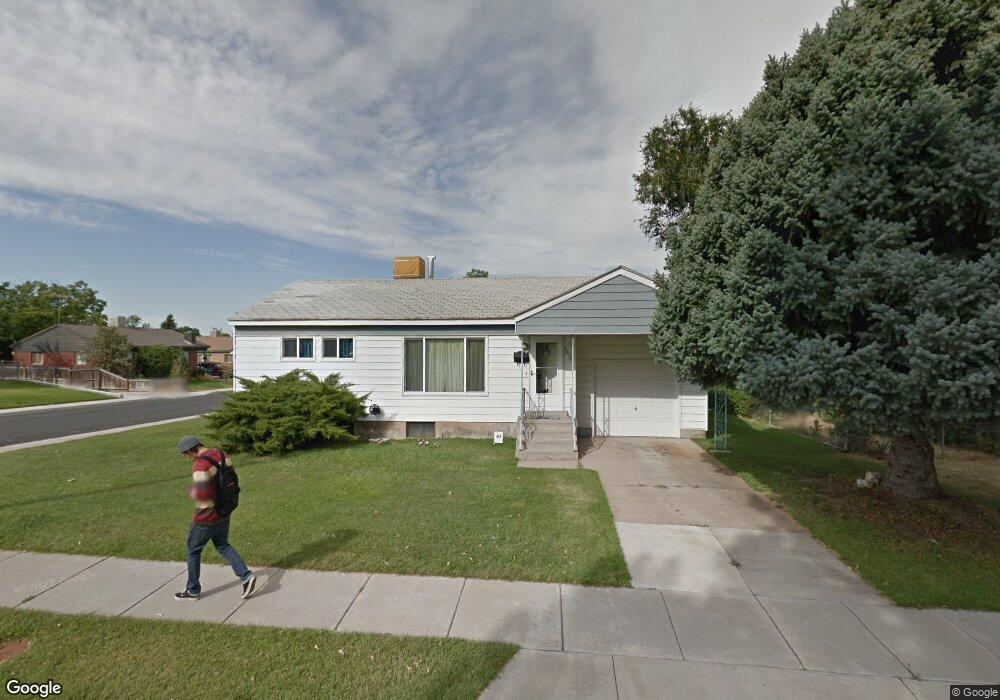
This home is located at 4639 S 300 E, Ogden, UT 84405 and is currently estimated at $377,789, approximately $214 per square foot. 4639 S 300 E is a home located in Weber County with nearby schools including Washington Terrace School, T.H. Bell Junior High School, and Bonneville High School.
Ownership History
Date
Name
Owned For
Owner Type
Purchase Details
Closed on
Apr 23, 2014
Sold by
Killian Gera
Bought by
Davidson Kyle A
Current Estimated Value
Home Financials for this Owner
Home Financials are based on the most recent Mortgage that was taken out on this home.
Original Mortgage
$126,415
Outstanding Balance
$96,027
Interest Rate
4.32%
Mortgage Type
New Conventional
Estimated Equity
$281,762
Purchase Details
Closed on
Sep 25, 2013
Sold by
Secretary Of Hud
Bought by
Killian Gera
Purchase Details
Closed on
Jun 25, 2013
Sold by
Utah Housing Corp
Bought by
The Secretary Of Hud
Purchase Details
Closed on
Feb 6, 2007
Sold by
Stamey Francene B
Bought by
Buskirk Deanna
Purchase Details
Closed on
May 19, 2006
Sold by
Stamey Francene B
Bought by
Stamey Francene B
Purchase Details
Closed on
Mar 31, 2006
Sold by
Stamey Francene B
Bought by
Clifton George A
Create a Home Valuation Report for This Property
The Home Valuation Report is an in-depth analysis detailing your home's value as well as a comparison with similar homes in the area
Home Values in the Area
Average Home Value in this Area
Purchase History
| Date | Buyer | Sale Price | Title Company |
|---|---|---|---|
| Davidson Kyle A | -- | Founders Title Co | |
| Killian Gera | -- | Founders Title Co Syracuse | |
| The Secretary Of Hud | -- | None Available | |
| Buskirk Deanna | -- | First American Title Layton | |
| Stamey Francene B | -- | Accommodation | |
| Clifton George A | -- | Accommodation |
Source: Public Records
Mortgage History
| Date | Status | Borrower | Loan Amount |
|---|---|---|---|
| Open | Davidson Kyle A | $126,415 |
Source: Public Records
Tax History
| Year | Tax Paid | Tax Assessment Tax Assessment Total Assessment is a certain percentage of the fair market value that is determined by local assessors to be the total taxable value of land and additions on the property. | Land | Improvement |
|---|---|---|---|---|
| 2025 | $2,449 | $359,911 | $112,390 | $247,521 |
| 2024 | $2,324 | $191,949 | $61,814 | $130,135 |
| 2023 | $2,269 | $187,550 | $61,251 | $126,299 |
| 2022 | $2,375 | $204,600 | $58,559 | $146,041 |
| 2021 | $1,944 | $271,000 | $56,191 | $214,809 |
| 2020 | $1,776 | $224,000 | $46,049 | $177,951 |
| 2019 | $1,746 | $204,000 | $46,049 | $157,951 |
| 2018 | $1,485 | $167,000 | $46,049 | $120,951 |
| 2017 | $1,342 | $139,000 | $30,922 | $108,078 |
| 2016 | $1,223 | $68,331 | $16,871 | $51,460 |
| 2015 | $1,240 | $68,331 | $16,871 | $51,460 |
| 2014 | $1,096 | $58,330 | $16,871 | $41,459 |
Source: Public Records
Map
Nearby Homes
- 4579 S 375 E
- 4803 S 350 E
- 291 E 4300 S
- 220 W 4800 S
- 4825 Burch Creek Dr
- 4558 S 300 W
- 4689 S 275 W
- 4856 S 300 W
- 137 Country Club Dr
- 403 Highland Dr
- 149 Country Club Dr
- 246 W 5000 S
- 5142 S 300 E
- 459 W 4575 S
- 4067 Hillcrest Cir
- 4694 S Ridgeline Dr
- 4055 Hillcrest Cir
- 3688 S Adams Ave
- 3112 S Adams Ave
- 571 Ben Lomond Ave
Your Personal Tour Guide
Ask me questions while you tour the home.