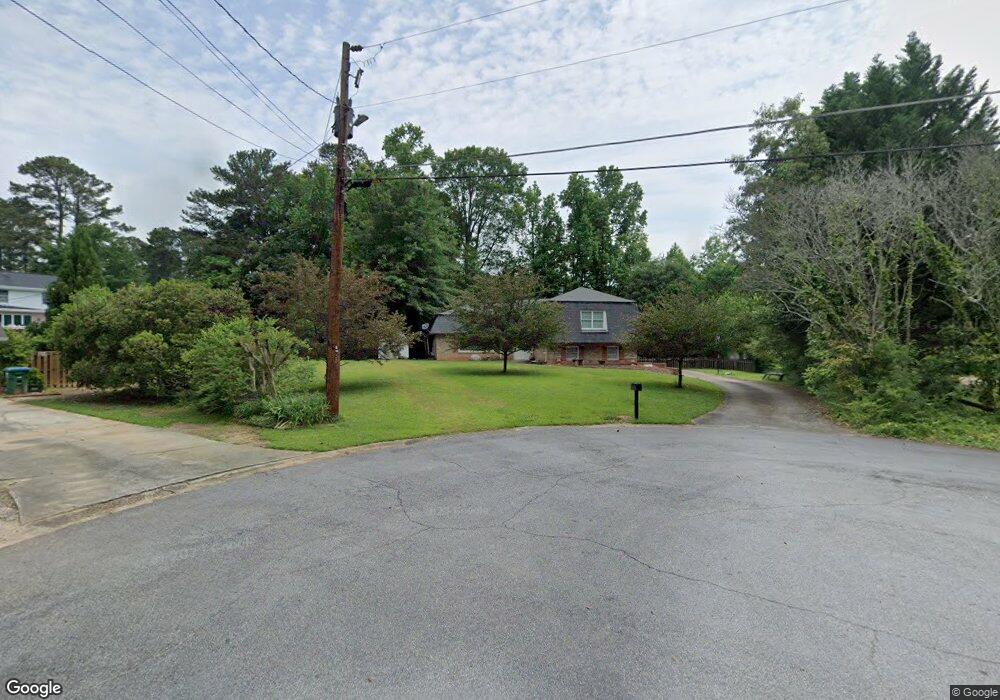
4639 Silversmith Cove SW Lilburn, GA 30047
Estimated Value: $316,000 - $395,000
4
Beds
3
Baths
1,994
Sq Ft
$179/Sq Ft
Est. Value
About This Home
This home is located at 4639 Silversmith Cove SW, Lilburn, GA 30047 and is currently estimated at $357,415, approximately $179 per square foot. 4639 Silversmith Cove SW is a home located in Gwinnett County with nearby schools including Camp Creek Elementary School, Trickum Middle School, and Parkview High School.
Ownership History
Date
Name
Owned For
Owner Type
Purchase Details
Closed on
Dec 21, 2009
Sold by
Hud & Housing Of Urban Dev
Bought by
Smith Richard and Smith Denise
Current Estimated Value
Home Financials for this Owner
Home Financials are based on the most recent Mortgage that was taken out on this home.
Original Mortgage
$87,098
Outstanding Balance
$56,638
Interest Rate
4.92%
Mortgage Type
FHA
Estimated Equity
$300,777
Purchase Details
Closed on
Mar 3, 2009
Sold by
Chase Home Finance Llc
Bought by
Hud-Housing Of Urban Dev
Purchase Details
Closed on
Dec 16, 1999
Sold by
Dick Paul E and Dick Mary H
Bought by
Owens Middleton U
Home Financials for this Owner
Home Financials are based on the most recent Mortgage that was taken out on this home.
Original Mortgage
$126,145
Interest Rate
7.68%
Mortgage Type
FHA
Create a Home Valuation Report for This Property
The Home Valuation Report is an in-depth analysis detailing your home's value as well as a comparison with similar homes in the area
Home Values in the Area
Average Home Value in this Area
Purchase History
| Date | Buyer | Sale Price | Title Company |
|---|---|---|---|
| Smith Richard | $66,700 | -- | |
| Hud-Housing Of Urban Dev | -- | -- | |
| Chase Hm Fin Llc | $116,655 | -- | |
| Owens Middleton U | $127,000 | -- |
Source: Public Records
Mortgage History
| Date | Status | Borrower | Loan Amount |
|---|---|---|---|
| Open | Smith Richard | $87,098 | |
| Previous Owner | Owens Middleton U | $126,145 |
Source: Public Records
Tax History Compared to Growth
Tax History
| Year | Tax Paid | Tax Assessment Tax Assessment Total Assessment is a certain percentage of the fair market value that is determined by local assessors to be the total taxable value of land and additions on the property. | Land | Improvement |
|---|---|---|---|---|
| 2025 | -- | $128,440 | $16,200 | $112,240 |
| 2024 | $3,848 | $129,080 | $16,200 | $112,880 |
| 2023 | $3,848 | $85,520 | $20,800 | $64,720 |
| 2022 | $2,698 | $75,200 | $20,800 | $54,400 |
| 2021 | $2,231 | $58,600 | $13,440 | $45,160 |
| 2020 | $2,242 | $58,600 | $13,440 | $45,160 |
| 2019 | $2,089 | $56,280 | $13,440 | $42,840 |
| 2018 | $1,974 | $53,120 | $10,240 | $42,880 |
| 2016 | $1,842 | $48,720 | $10,240 | $38,480 |
| 2015 | $1,875 | $49,160 | $8,960 | $40,200 |
| 2014 | $1,884 | $49,160 | $8,960 | $40,200 |
Source: Public Records
Map
Nearby Homes
- 4704 Arrowhead Trail SW
- 4567 Town Crier Rd SW
- 4582 Warrior Trail SW
- 4814 Delgado Dr SW
- 4872 Arrowhead Trail West SW Unit 1
- 562 Gregg Dr SW
- 4702 Sequoia Dr SW
- 4406 Hale Dr SW
- 4367 Cedar Wood Dr SW
- 551 Killian Hill Rd SW
- 5000 Bainbridge Ct SW
- 311 Arbor Point Ct SW
- 4307 Cedar Wood Dr SW
- 5041 Bainbridge Ct SW Unit 3
- 676 Killian Hill Rd SW
- 383 Ben Ave SW
- 4637 Silversmith Cove SW
- 607 Planters Row SW Unit 2
- 592 Emily Dr SW Unit 2
- 4642 Silversmith Cove SW Unit 2
- 617 Planters Row SW
- 0 Silversmith Cove SW Unit 3115804
- 587 Planters Row SW
- 4688 Emily Dr SW
- 4646 Silversmith Cove SW
- 582 Emily Dr SW
- 577 Planters Row SW Unit 6
- 577 Planters Row SW
- 4617 Town Crier Rd SW
- 0 Planters Roe Unit 6
- 4708 Emily Dr SW
- 572 Emily Dr SW
- 573 Emily Dr SW
- 0 Planters Row SW Unit 7417978
- 0 Planters Row SW Unit 8686282
- 0 Planters Row SW Unit 8292264