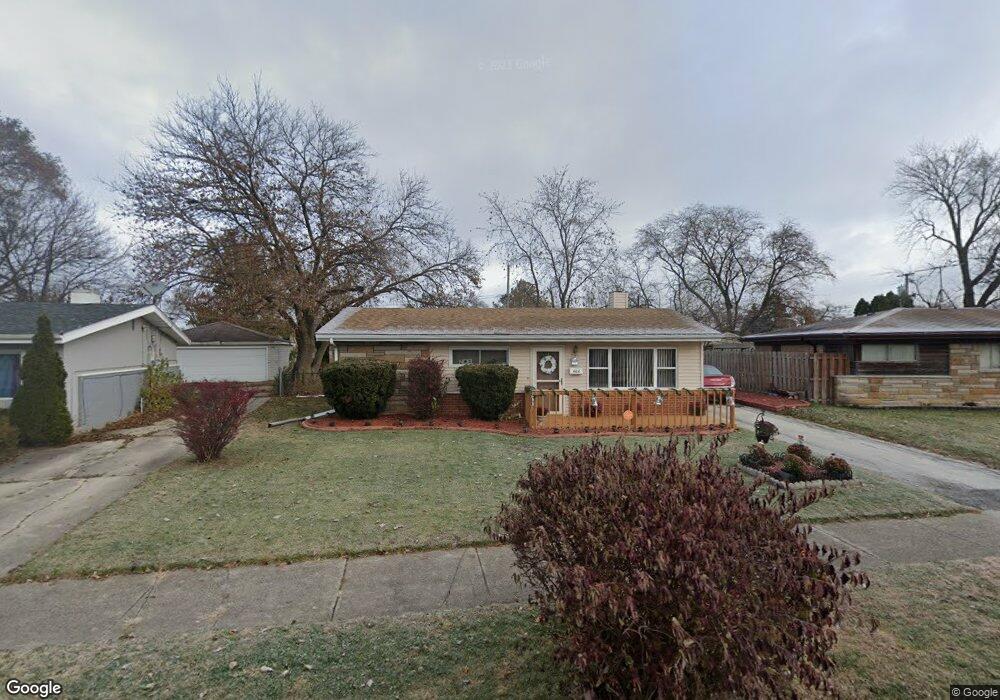
464 163rd Place Calumet City, IL 60409
Estimated Value: $144,000 - $168,000
3
Beds
1
Bath
999
Sq Ft
$157/Sq Ft
Est. Value
About This Home
This home is located at 464 163rd Place, Calumet City, IL 60409 and is currently estimated at $156,489, approximately $156 per square foot. 464 163rd Place is a home located in Cook County with nearby schools including Hoover Elementary School, Schrum Memorial Middle School, and Thornton Fractional North High School.
Ownership History
Date
Name
Owned For
Owner Type
Purchase Details
Closed on
Jun 22, 1999
Sold by
Graves Keith
Bought by
Mootrie Linda and Graves Keith
Current Estimated Value
Purchase Details
Closed on
Oct 31, 1997
Sold by
Peterson Anne J
Bought by
Graves Keith
Home Financials for this Owner
Home Financials are based on the most recent Mortgage that was taken out on this home.
Original Mortgage
$77,761
Outstanding Balance
$12,875
Interest Rate
7.38%
Mortgage Type
FHA
Estimated Equity
$143,614
Purchase Details
Closed on
Nov 1, 1995
Sold by
American National Bk & Tr Co Of Chicago
Bought by
Peterson Anne J
Purchase Details
Closed on
Dec 7, 1993
Sold by
Peterson David E
Bought by
First Chicago Trust Company Of Illinois
Purchase Details
Closed on
Nov 18, 1993
Sold by
Lasalle National Trust Na
Bought by
Peterson David E
Create a Home Valuation Report for This Property
The Home Valuation Report is an in-depth analysis detailing your home's value as well as a comparison with similar homes in the area
Home Values in the Area
Average Home Value in this Area
Purchase History
| Date | Buyer | Sale Price | Title Company |
|---|---|---|---|
| Mootrie Linda | -- | -- | |
| Graves Keith | $78,000 | Attorneys Natl Title Network | |
| Peterson Anne J | -- | -- | |
| First Chicago Trust Company Of Illinois | -- | -- | |
| Peterson David E | $40,000 | -- |
Source: Public Records
Mortgage History
| Date | Status | Borrower | Loan Amount |
|---|---|---|---|
| Open | Graves Keith | $77,761 |
Source: Public Records
Tax History Compared to Growth
Tax History
| Year | Tax Paid | Tax Assessment Tax Assessment Total Assessment is a certain percentage of the fair market value that is determined by local assessors to be the total taxable value of land and additions on the property. | Land | Improvement |
|---|---|---|---|---|
| 2024 | $5,053 | $11,000 | $2,786 | $8,214 |
| 2023 | $3,102 | $11,000 | $2,786 | $8,214 |
| 2022 | $3,102 | $7,059 | $2,458 | $4,601 |
| 2021 | $3,119 | $7,058 | $2,458 | $4,600 |
| 2020 | $2,796 | $7,058 | $2,458 | $4,600 |
| 2019 | $2,838 | $7,247 | $2,294 | $4,953 |
| 2018 | $2,852 | $7,247 | $2,294 | $4,953 |
| 2017 | $2,751 | $7,247 | $2,294 | $4,953 |
| 2016 | $2,683 | $6,479 | $2,130 | $4,349 |
| 2015 | $2,560 | $6,479 | $2,130 | $4,349 |
| 2014 | $2,497 | $6,479 | $2,130 | $4,349 |
| 2013 | $2,661 | $7,135 | $2,130 | $5,005 |
Source: Public Records
Map
Nearby Homes
- 1387 Price Ave
- 1395 Freeland Ave
- 1366 Price Ave
- 1421 Burnham Ave
- 1433 Burnham Ave
- 1351 Gordon Ave
- 1455 Burnham Ave
- 1373 Stanley Blvd
- 1404 Burnham Ave
- 1354 Hirsch Ave
- 1341 Gordon Ave
- 1494 Stanley Blvd
- 1383 Greenbay Ave
- 1375 Forest Place
- 1481 Lincoln Place
- 1313 Gordon Ave
- 1304 Freeland Ave
- 1490 Lincoln Ave
- 1517 Freeland Ave
- 1481 Lincoln Ave