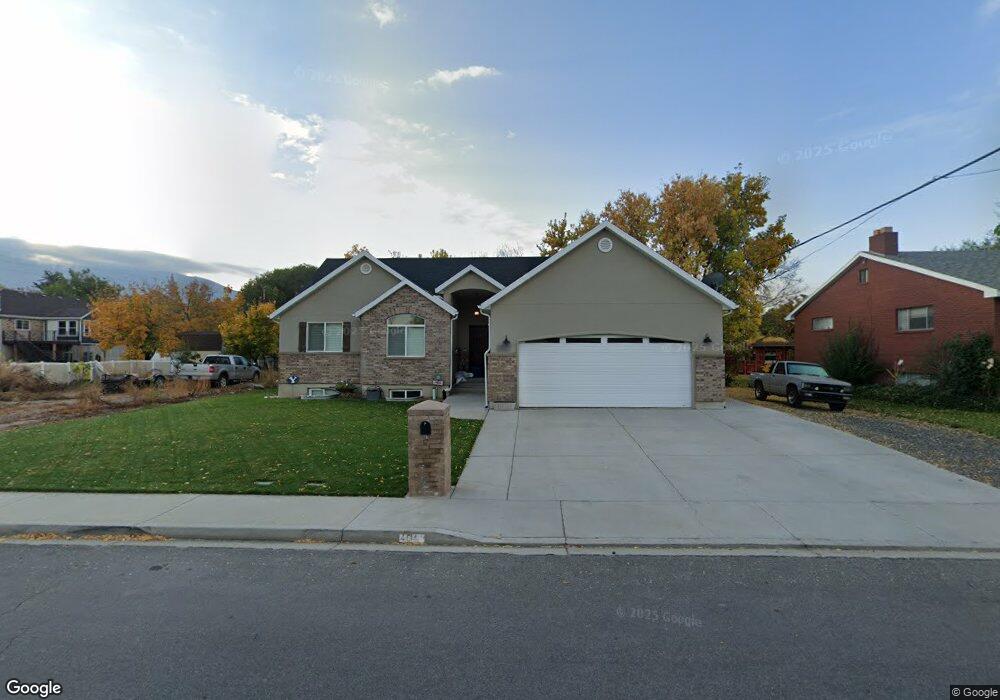
464 E 200 N Payson, UT 84651
Estimated Value: $485,000 - $514,000
3
Beds
3
Baths
1,488
Sq Ft
$339/Sq Ft
Est. Value
About This Home
This home is located at 464 E 200 N, Payson, UT 84651 and is currently estimated at $503,998, approximately $338 per square foot. 464 E 200 N is a home with nearby schools including Barnett Elementary School, Salem Junior High School, and Valley View Middle School.
Ownership History
Date
Name
Owned For
Owner Type
Purchase Details
Closed on
Jun 26, 2017
Sold by
Madson Iris Kay and Iris Kay Madson Family Trust
Bought by
Madson Iris Kay
Current Estimated Value
Home Financials for this Owner
Home Financials are based on the most recent Mortgage that was taken out on this home.
Original Mortgage
$243,000
Interest Rate
4.02%
Mortgage Type
Construction
Purchase Details
Closed on
Apr 20, 2017
Sold by
Madson Iris W
Bought by
Madson Raydon K and Madson Michelle M
Purchase Details
Closed on
Feb 17, 2017
Sold by
Madson Raydon and Madson Iris W
Bought by
Madson Iris W
Purchase Details
Closed on
Feb 1, 2017
Sold by
Madson Iris W
Bought by
Madson Iris Kay and Iris Kay Madson Family Trust
Purchase Details
Closed on
Aug 30, 2010
Sold by
Madson Raydon and Madson Iris W
Bought by
Madson Raydon and Madson Iris W
Create a Home Valuation Report for This Property
The Home Valuation Report is an in-depth analysis detailing your home's value as well as a comparison with similar homes in the area
Home Values in the Area
Average Home Value in this Area
Purchase History
| Date | Buyer | Sale Price | Title Company |
|---|---|---|---|
| Madson Iris Kay | -- | Accommodation | |
| Madson Raydon K | -- | Accommodation | |
| Madson Iris W | -- | None Available | |
| Madson Iris Kay | -- | None Available | |
| Madson Raydon | -- | None Available |
Source: Public Records
Mortgage History
| Date | Status | Borrower | Loan Amount |
|---|---|---|---|
| Closed | Madson Iris Kay | $243,000 |
Source: Public Records
Tax History
| Year | Tax Paid | Tax Assessment Tax Assessment Total Assessment is a certain percentage of the fair market value that is determined by local assessors to be the total taxable value of land and additions on the property. | Land | Improvement |
|---|---|---|---|---|
| 2025 | $2,362 | $271,425 | -- | -- |
| 2024 | $2,362 | $240,405 | $0 | $0 |
| 2023 | $2,331 | $237,930 | $0 | $0 |
| 2022 | $2,226 | $223,410 | $0 | $0 |
| 2021 | $1,904 | $306,500 | $78,100 | $228,400 |
| 2020 | $1,777 | $279,800 | $67,900 | $211,900 |
| 2019 | $1,648 | $266,100 | $61,100 | $205,000 |
| 2018 | $1,556 | $242,100 | $51,600 | $190,500 |
| 2017 | $584 | $48,900 | $0 | $0 |
| 2016 | $530 | $44,100 | $0 | $0 |
| 2015 | $493 | $40,700 | $0 | $0 |
| 2014 | $448 | $37,300 | $0 | $0 |
Source: Public Records
Map
Nearby Homes
Your Personal Tour Guide
Ask me questions while you tour the home.