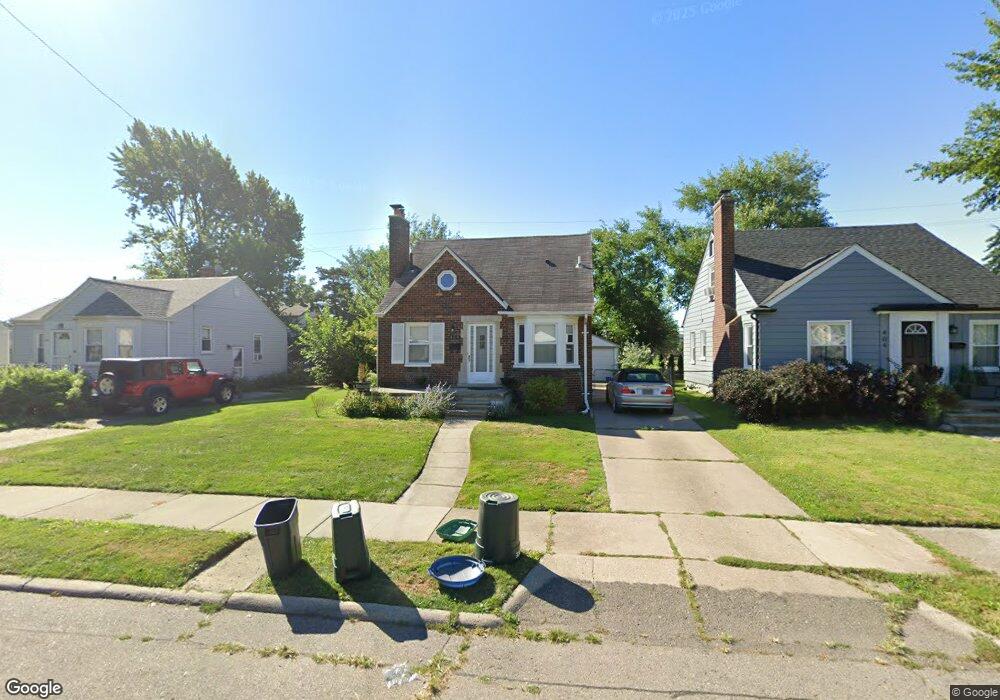
464 E Chesterfield St Unit Bldg-Unit Ferndale, MI 48220
Estimated Value: $205,000 - $258,000
About This Home
This home is located at 464 E Chesterfield St Unit Bldg-Unit, Ferndale, MI 48220 and is currently estimated at $234,194, approximately $250 per square foot. 464 E Chesterfield St Unit Bldg-Unit is a home located in Oakland County with nearby schools including Ferndale Lower Elementary Campus, Ferndale Upper Elementary Campus, and Ferndale Middle School.
Ownership History
Purchase Details
Purchase Details
Purchase Details
Purchase Details
Home Financials for this Owner
Home Financials are based on the most recent Mortgage that was taken out on this home.Purchase Details
Home Values in the Area
Average Home Value in this Area
Purchase History
We collect this data history from publicly available records. To have your information removed, we recommend requesting removal directly through your county’s website.
| Date | Buyer | Sale Price | Title Company |
|---|---|---|---|
| Porter Gregory L | $139,000 | None Available | |
| Abb Development Llc | $112,001 | First American Title Insuran | |
| Amerifirst Financial Corp | $86,250 | None Available | |
| Patterson Lacey L | $89,900 | Stg | |
| Rymsza Frank | -- | None Available |
Mortgage History
We collect this data history from publicly available records. To have your information removed, we recommend requesting removal directly through your county’s website.
| Date | Status | Borrower | Loan Amount |
|---|---|---|---|
| Previous Owner | Patterson Lacey L | $88,271 |
Tax History
| Year | Tax Paid | Tax Assessment Tax Assessment Total Assessment is a certain percentage of the fair market value that is determined by local assessors to be the total taxable value of land and additions on the property. | Land | Improvement |
|---|---|---|---|---|
| 2025 | $5,139 | $115,340 | $0 | $0 |
| 2024 | $4,953 | $109,680 | $0 | $0 |
| 2023 | $4,928 | $106,420 | $0 | $0 |
| 2022 | $4,345 | $98,480 | $0 | $0 |
| 2021 | $4,722 | $94,630 | $0 | $0 |
| 2020 | $4,140 | $89,660 | $0 | $0 |
| 2019 | $4,208 | $74,850 | $0 | $0 |
| 2018 | $5,707 | $72,470 | $0 | $0 |
| 2017 | $3,997 | $66,420 | $0 | $0 |
| 2016 | $3,549 | $53,130 | $0 | $0 |
| 2015 | -- | $40,460 | $0 | $0 |
| 2014 | -- | $35,940 | $0 | $0 |
| 2011 | -- | $49,470 | $0 | $0 |
Map
- 691 E Bennett Ave
- 426 E Webster St
- 839 E Bennett Ave
- 321 E Webster St
- 440 Jewell St
- 301 Spencer St
- 420 Silman St
- 708 Channing St
- 634 Channing St
- 872 Channing St
- 231 W Bennett Ave
- 186 Jewell St
- 266 W Bennett Ave
- 306 Silman St
- 243 W Webster St
- 233 Silman St
- 366 W Bennett
- 2597 W 8 Mile Rd
- 1448 E Webster St
- 1381 E Chesterfield St
- 464 E Chesterfield St
- 484 E Chesterfield St
- 502 E Chesterfield St
- 404 E Chesterfield St
- 481 E Bennette St
- 520 E Chesterfield St
- 503 E Bennette St
- 530 E Chesterfield St
- 485 E Chesterfield St
- 465 E Chesterfield St
- 521 E Bennett Ave
- 354 E Chesterfield St Unit Bldg-Unit
- 354 E Chesterfield St
- 505 E Chesterfield St
- 455 E Chesterfield St
- 521 E Bennette St
- 385 E Chesterfield St
- 521 E Chesterfield St
- 375 E Chesterfield St
- 560 E Chesterfield St
Ask me questions while you tour the home.