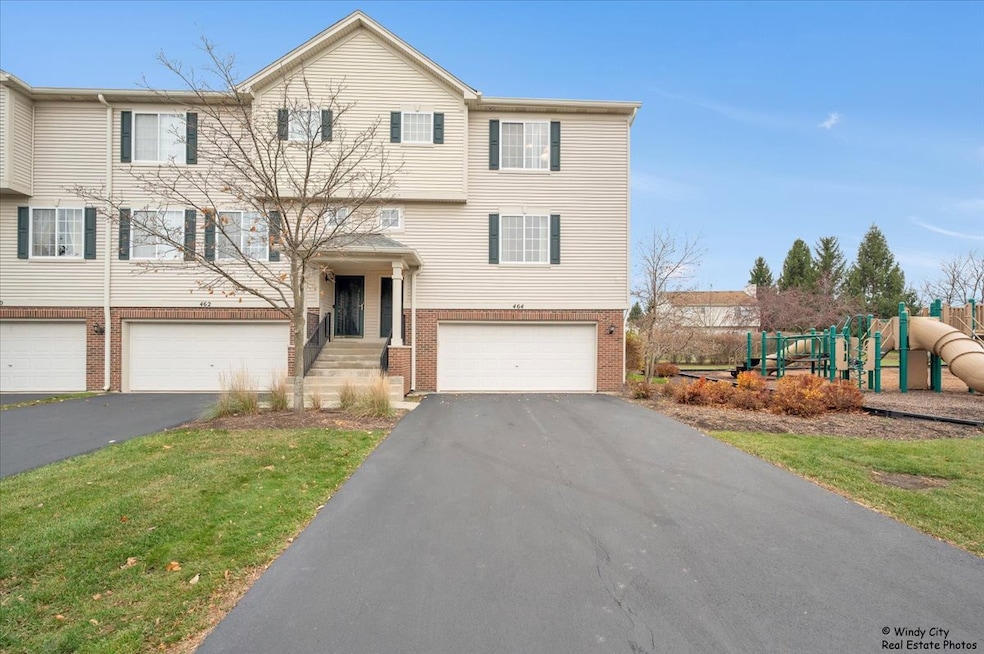
464 Evergreen Cir Unit 6026 Gilberts, IL 60136
Estimated payment $2,180/month
Highlights
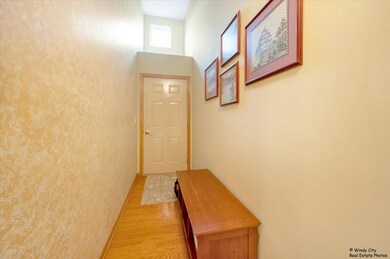
- Wood Flooring
- Bonus Room
- Park
- Gilberts Elementary School Rated A-
- Walk-In Closet
- Resident Manager or Management On Site
About This Home
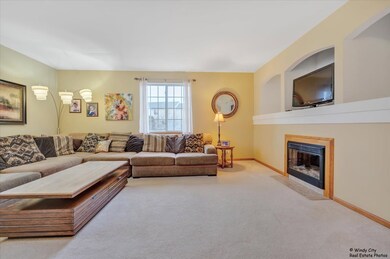
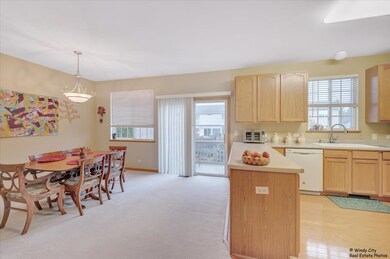
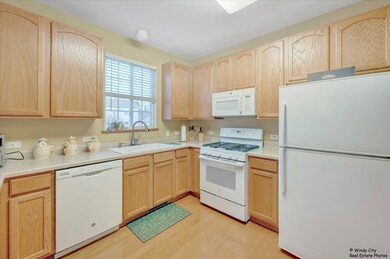
This Timber Trails home is warm, welcoming, and ready for you to make it your own. This bright and spacious 3-bedroom, 2.5-bath corner-unit townhouse offers comfort, convenience, and an unbeatable location in one of Gilberts' most loved communities. On the main level, enjoy an open layout filled with natural light, with room to gather, create, and enjoy everyday living. Upstairs, you'll find three generous bedrooms, including a primary suite with its own private bath and walk-in closet. Whether you need extra space for guests, a home office, or a cozy retreat, this layout gives you the flexibility you're looking for. One of the best features? The location! This home sits right next to a neighborhood park, giving you instant access to green space, walking paths, and the heart of Timber Trails living. Whether you're heading out for a jog, letting the kids play, or enjoying a peaceful evening stroll, it's all just steps from your front door. As a corner unit, you'll enjoy additional natural light throughout, and the attached garage offers year-round convenience. Move-in ready with a spacious layout, and a fantastic community, it's the perfect place to truly make your own. Whether you're looking to buy your first home, downsize with comfort, or invest in a property with strong potential, you won't want to miss this one!
Listing Agent
Baird & Warner Real Estate - A License #475211735 Listed on: 11/28/2025

Open House Schedule
-
Saturday, November 29, 202511:00 am to 1:00 pm11/29/2025 11:00:00 AM +00:0011/29/2025 1:00:00 PM +00:00Add to Calendar
Townhouse Details
Home Type
- Townhome
Est. Annual Taxes
- $5,398
Year Built
- Built in 2002
HOA Fees
Parking
- 2 Car Garage
- Driveway
Home Design
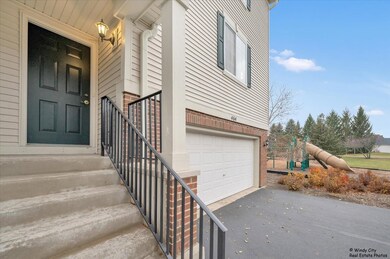
- Entry on the 2nd floor
- Brick Exterior Construction
Interior Spaces
- 1,768 Sq Ft Home
- 3-Story Property
- Entrance Foyer
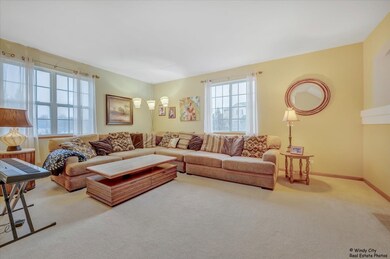
- Family Room
- Living Room with Fireplace
- Dining Room
- Bonus Room
- Laundry Room
Flooring
- Wood
- Carpet
Bedrooms and Bathrooms
- 3 Bedrooms
- 3 Potential Bedrooms
- Walk-In Closet
Utilities
- Forced Air Heating and Cooling System
- Heating System Uses Natural Gas
Listing and Financial Details
- Homeowner Tax Exemptions
Community Details
Overview
- Association fees include water, insurance, exterior maintenance, lawn care, scavenger, snow removal
- 4 Units
- Cindy Association, Phone Number (866) 473-2573
- Timber Trails Subdivision
- Property managed by Timber Trails U 4 Condo Association/Real Manage
Recreation
- Park
- Trails
- Bike Trail
Pet Policy
- Dogs and Cats Allowed
Security
- Resident Manager or Management On Site
Map
Home Values in the Area
Average Home Value in this Area
Tax History
| Year | Tax Paid | Tax Assessment Tax Assessment Total Assessment is a certain percentage of the fair market value that is determined by local assessors to be the total taxable value of land and additions on the property. | Land | Improvement |
|---|---|---|---|---|
| 2024 | $5,398 | $76,779 | $16,034 | $60,745 |
| 2023 | $5,231 | $69,433 | $14,500 | $54,933 |
| 2022 | $5,114 | $64,017 | $13,369 | $50,648 |
| 2021 | $4,957 | $60,211 | $12,574 | $47,637 |
| 2020 | $4,869 | $58,674 | $12,253 | $46,421 |
| 2019 | $4,739 | $56,314 | $11,760 | $44,554 |
| 2018 | $4,602 | $52,852 | $11,037 | $41,815 |
| 2017 | $4,499 | $50,330 | $10,510 | $39,820 |
| 2016 | $4,420 | $47,915 | $10,006 | $37,909 |
| 2015 | -- | $45,254 | $9,450 | $35,804 |
| 2014 | -- | $46,564 | $10,760 | $35,804 |
| 2013 | -- | $48,638 | $10,957 | $37,681 |
Property History
| Date | Event | Price | List to Sale | Price per Sq Ft |
|---|---|---|---|---|
| 11/28/2025 11/28/25 | For Sale | $270,000 | -- | $153 / Sq Ft |
Purchase History
| Date | Type | Sale Price | Title Company |
|---|---|---|---|
| Warranty Deed | $214,000 | Multiple | |
| Warranty Deed | $184,000 | Chicago Title Insurance Co | |
| Special Warranty Deed | $179,000 | First American Title Co |
Mortgage History
| Date | Status | Loan Amount | Loan Type |
|---|---|---|---|
| Open | $171,200 | Purchase Money Mortgage | |
| Previous Owner | $155,000 | Purchase Money Mortgage | |
| Previous Owner | $169,989 | No Value Available |
Source: Midwest Real Estate Data (MRED)
MLS Number: 12502461
APN: 02-25-380-022
Disclaimer: Certain information contained herein is derived from information provided by parties other than Homes.com. All information provided is deemed reliable, but is not guaranteed to be accurate and should be independently verified.
![]() Based on information submitted to the MLS GRID. All data is obtained from various sources and may not have been verified by broker or MLS GRID. Supplied Open House Information is subject to change without notice. All information should be independently reviewed and verified for accuracy. Properties may or may not be listed by the office/agent presenting the information. Some IDX listings have been excluded from this website.
Based on information submitted to the MLS GRID. All data is obtained from various sources and may not have been verified by broker or MLS GRID. Supplied Open House Information is subject to change without notice. All information should be independently reviewed and verified for accuracy. Properties may or may not be listed by the office/agent presenting the information. Some IDX listings have been excluded from this website.
The Digital Millennium Copyright Act of 1998, 17 U.S.C. § 512 (the “DMCA”) provides recourse for copyright owners who believe that material appearing on the Internet infringes their rights under U.S. copyright law. If you believe in good faith that any content or material made available in connection with our website or services infringes your copyright, you (or your agent) may send us a notice requesting that the content or material be removed, or access to it blocked.
Notices must be sent in writing by email to DMCAnotice@MLSGrid.com.
The DMCA requires that your notice of alleged copyright infringement include the following information:
(1) description of the copyrighted work that is the subject of claimed infringement;
(2) description of the alleged infringing content and information sufficient to permit us to locate the content;
(3) contact information for you, including your address, telephone number and email address;
(4) a statement by you that you have a good faith belief that the content in the manner complained of is not authorized by the copyright owner, or its agent, or by the operation of any law;
(5) a statement by you, signed under penalty of perjury, that the information in the notification is accurate and that you have the authority to enforce the copyrights that are claimed to be infringed; and
(6) a physical or electronic signature of the copyright owner or a person authorized to act on the copyright owner’s behalf. Failure to include all of the above information may result in the delay of the processing of your complaint.
- 449 Evergreen Cir Unit 6035
- 445 Evergreen Cir Unit 6033
- 409 Evergreen Cir Unit 4
- 204 Aspen Cir Unit 1
- 316 Gregory m Sears Dr Unit 8
- 327 Gregory m Sears Dr Unit 8
- 125 Augusta Dr Unit 8
- 188 Breckenridge Ct Unit 5
- 281 Boulder Ct Unit 6
- 54 Meadows Dr
- 910 Tipperary St
- 14N468 Bonnie Ln
- 0 Tyrrell Rd
- 378 Pierce St
- 447 Jean St
- 215 Tollview Ct
- 413 Town Center Blvd
- 152 Jackson St Unit 2821
- 462 Town Center Blvd
- 3500 Hopewell Place
- 133 Willey St Unit 2755
- 2511 Watermark Terrace
- 434 Town Center Blvd
- 895 Brielle Blvd
- 400 N Randall Rd
- 2120 Belvidere Line Dr
- 3388 Sanctuary Dr Unit 52
- 1613 Gleneagle Ct
- 500 Redtail Ridge
- 200 Goldenrod Dr
- 1814 Van Dyke Ln Unit 1
- 192 Goldenrod Dr
- 3831 Currant Ln
- 208 Goldenrod Dr Unit 1
- 545 Yorkshire Ln
- 2314 Woodside Dr
- 2314 Woodside Dr Unit 34C2
- 1068 Todd Farm Dr
- 818 Glen Cove Ln
- 485 N Airlite St