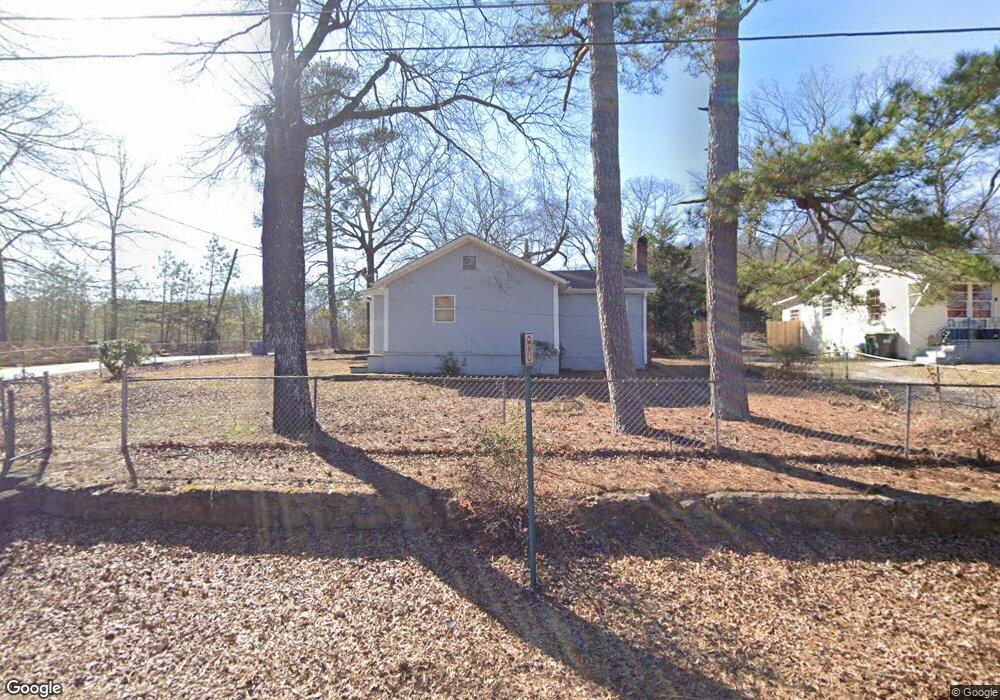
464 Francis Cir SW Mableton, GA 30126
Estimated Value: $217,000 - $278,000
3
Beds
2
Baths
1,560
Sq Ft
$161/Sq Ft
Est. Value
About This Home
This home is located at 464 Francis Cir SW, Mableton, GA 30126 and is currently estimated at $250,475, approximately $160 per square foot. 464 Francis Cir SW is a home located in Cobb County with nearby schools including Clay-Harmony Leland Elementary School, Lindley Middle School, and Pebblebrook High School.
Ownership History
Date
Name
Owned For
Owner Type
Purchase Details
Closed on
Jun 12, 2015
Sold by
M2b Investments Llc
Bought by
Venture Homes Inc
Current Estimated Value
Purchase Details
Closed on
Apr 29, 2008
Sold by
Boxall Ian
Bought by
464 Francis Circle Land Trust
Purchase Details
Closed on
Feb 12, 2008
Sold by
Canltanta Props Llc
Bought by
Boxall Ian
Purchase Details
Closed on
Jan 4, 2008
Sold by
Fedl Natl Mtg Assoc
Bought by
Canlanta Prop Llc
Purchase Details
Closed on
Mar 6, 2007
Sold by
Countrywide Home Loans Inc
Bought by
Federal National Mortgage Association
Purchase Details
Closed on
Mar 6, 1995
Sold by
Baxter Jack Teresa
Bought by
Privado Miguel A Ana M
Create a Home Valuation Report for This Property
The Home Valuation Report is an in-depth analysis detailing your home's value as well as a comparison with similar homes in the area
Home Values in the Area
Average Home Value in this Area
Purchase History
| Date | Buyer | Sale Price | Title Company |
|---|---|---|---|
| Venture Homes Inc | $121,250 | -- | |
| 464 Francis Circle Land Trust | -- | -- | |
| Boxall Ian | -- | -- | |
| Canlanta Prop Llc | -- | -- | |
| Federal National Mortgage Association | -- | -- | |
| Countrywide Home Loans Inc | $100,581 | -- | |
| Privado Miguel A Ana M | $41,600 | -- |
Source: Public Records
Mortgage History
| Date | Status | Borrower | Loan Amount |
|---|---|---|---|
| Closed | Privado Miguel A Ana M | $0 |
Source: Public Records
Tax History Compared to Growth
Tax History
| Year | Tax Paid | Tax Assessment Tax Assessment Total Assessment is a certain percentage of the fair market value that is determined by local assessors to be the total taxable value of land and additions on the property. | Land | Improvement |
|---|---|---|---|---|
| 2025 | $2,292 | $76,076 | $30,020 | $46,056 |
| 2024 | $2,294 | $76,076 | $30,020 | $46,056 |
| 2023 | $1,900 | $63,012 | $28,440 | $34,572 |
| 2022 | $1,769 | $58,272 | $23,700 | $34,572 |
| 2021 | $1,535 | $50,576 | $21,488 | $29,088 |
| 2020 | $1,362 | $44,888 | $15,800 | $29,088 |
| 2019 | $1,145 | $37,736 | $11,060 | $26,676 |
| 2018 | $960 | $31,640 | $7,584 | $24,056 |
| 2017 | $713 | $24,804 | $5,056 | $19,748 |
| 2016 | $713 | $24,804 | $5,056 | $19,748 |
| 2015 | $649 | $22,040 | $5,056 | $16,984 |
| 2014 | -- | $22,040 | $0 | $0 |
Source: Public Records
Map
Nearby Homes
- 5859 Lone Oak Dr SW
- 220 Lane Dr
- 6233 Honeybell Alley
- Knollwood Plan at Mableton Station - Townhomes
- 6243 Honeybell Alley
- Harbor Plan at Mableton Station
- Manning Plan at Mableton Station
- Robie Plan at Mableton Station
- Aisle Plan at Mableton Station
- Elston Plan at Mableton Station
- 317 Community Dr SW
- 522 Elizabeth Ln SW
- 5981 Pisgah Rd SW
- 5607 Beaver Dr SW
- 9 Cooper Lake Rd SW
- 91 Park Rd Sw Rd
- 496 Elizabeth Ln SW
- 5554 Leland Ct SW
- 537 Elizabeth Ln SW
- 6001 Liatris St
- 454 Francis Cir SW
- 470 Gresham Rd SW
- 434 Francis Cir SW
- 455 Francis Cir SW
- 409 Gresham Rd SW
- 506 Gresham Rd SW
- 0 Gresham Rd SW Unit 7454102
- 0 Gresham Rd SW Unit 3254921
- 0 Gresham Rd SW Unit 3113162
- 0 Gresham Rd SW Unit 8857588
- 0 Gresham Rd SW Unit 8266356
- 0 Gresham Rd SW Unit 8189197
- 0 Gresham Rd SW Unit 7553502
- 0 Gresham Rd SW Unit 8288960
- 0 Gresham Rd SW Unit 8102602
- 0 Gresham Rd SW Unit 8321272
- 0 Gresham Rd SW Unit 2762617
- 0 Gresham Rd SW Unit 8696190
- 0 Gresham Rd SW Unit 8598617
- 0 Gresham Rd SW Unit 7597291