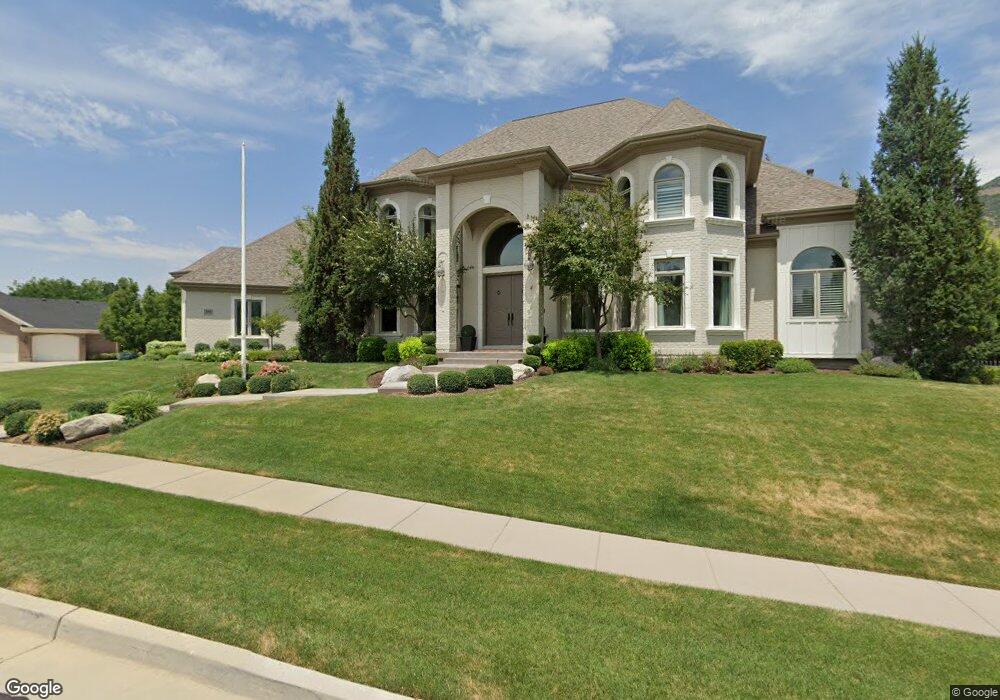
464 Hidden Meadow Way Unit 14 Farmington, UT 84025
Estimated Value: $1,900,000 - $2,571,516
4
Beds
4
Baths
4,641
Sq Ft
$482/Sq Ft
Est. Value
About This Home
This home is located at 464 Hidden Meadow Way Unit 14, Farmington, UT 84025 and is currently estimated at $2,235,758, approximately $481 per square foot. 464 Hidden Meadow Way Unit 14 is a home located in Davis County with nearby schools including Knowlton Elementary School, Farmington High, and Farmington Junior High School.
Ownership History
Date
Name
Owned For
Owner Type
Purchase Details
Closed on
Mar 29, 2010
Sold by
Wendel Todd E and Wendel Teresa N
Bought by
Reynolds Jeffery P
Current Estimated Value
Home Financials for this Owner
Home Financials are based on the most recent Mortgage that was taken out on this home.
Original Mortgage
$183,000
Outstanding Balance
$120,629
Interest Rate
4.95%
Mortgage Type
Credit Line Revolving
Estimated Equity
$2,115,129
Purchase Details
Closed on
May 20, 2005
Sold by
Shadow Ridge Development Lc
Bought by
Wendel Todd and Wendel Teresa
Purchase Details
Closed on
Mar 7, 2003
Sold by
Wortley Leann Parry
Bought by
Shadow Ridge Development Lc
Home Financials for this Owner
Home Financials are based on the most recent Mortgage that was taken out on this home.
Original Mortgage
$1,664,000
Interest Rate
5.83%
Mortgage Type
Construction
Create a Home Valuation Report for This Property
The Home Valuation Report is an in-depth analysis detailing your home's value as well as a comparison with similar homes in the area
Home Values in the Area
Average Home Value in this Area
Purchase History
| Date | Buyer | Sale Price | Title Company |
|---|---|---|---|
| Reynolds Jeffery P | -- | Equity Title Ins Agency Inc | |
| Wendel Todd | -- | First American Title | |
| Shadow Ridge Development Lc | -- | First American Title Co |
Source: Public Records
Mortgage History
| Date | Status | Borrower | Loan Amount |
|---|---|---|---|
| Open | Reynolds Jeffery P | $183,000 | |
| Open | Reynolds Jeffery P | $417,000 | |
| Previous Owner | Shadow Ridge Development Lc | $1,664,000 |
Source: Public Records
Tax History Compared to Growth
Tax History
| Year | Tax Paid | Tax Assessment Tax Assessment Total Assessment is a certain percentage of the fair market value that is determined by local assessors to be the total taxable value of land and additions on the property. | Land | Improvement |
|---|---|---|---|---|
| 2025 | $13,776 | $1,360,700 | $257,248 | $1,103,452 |
| 2024 | $12,300 | $1,229,799 | $241,954 | $987,845 |
| 2023 | $11,038 | $1,107,150 | $190,535 | $916,614 |
| 2022 | $10,233 | $1,925,000 | $333,046 | $1,591,954 |
| 2021 | $8,693 | $1,339,000 | $273,681 | $1,065,319 |
| 2020 | $8,824 | $1,325,000 | $261,424 | $1,063,576 |
| 2019 | $8,739 | $1,273,000 | $241,714 | $1,031,286 |
| 2018 | $8,061 | $1,157,000 | $253,832 | $903,168 |
| 2016 | $7,176 | $530,200 | $81,198 | $449,002 |
| 2015 | $8,042 | $563,860 | $81,198 | $482,662 |
| 2014 | $9,662 | $696,243 | $81,198 | $615,045 |
| 2013 | -- | $393,254 | $68,698 | $324,556 |
Source: Public Records
Map
Nearby Homes
- 1327 Hidden Quail Cove Unit 6-A
- 388 Quail Run Rd
- 588 W 1175 N
- 1512 Cherry Blossom Dr
- 1563 N Compton Rd
- 695 W Hidden Farm Dr
- 154 W 1100 N
- 1886 W 950 N Unit 3
- 1008 N Shepard Creek Pkwy Unit 5
- 1090 N Shepard Creek Pkwy Unit 6
- 1048 Shepard Creek Pkwy Unit 4
- 907 Farmington Crossing
- 1177 Shepard Ln
- 1212 Pinehurst Cir
- 1766 View Ct
- 1563 Oakridge Park Dr
- 1485 W Burke Ln Unit 102
- 1493 W Burke Ln Unit 101
- 1476 W 550 N Unit 161
- 1460 W 550 N Unit 166
- 464 N Hidden Meadow Way W
- 1282 Woodland Ct
- 1282 N Woodland Ct W Unit 14
- 457 Hidden Meadow Way Unit 13
- 471 Hidden Meadow Way
- 471 Hidden Meadow Way Unit 12
- 457 Hidden Meadow Way
- 1302 Woodland Ct
- 1302 Woodland Ct Unit 16
- 498 Hidden Meadow Way
- 471 Hidden Meadow Way
- 1287 Woodland Ct Unit 19
- 487 Hidden Meadow Way Unit 11
- 1303 Woodland Ct Unit 17
- 487 Hidden Meadow Way
- 1284 Hidden Quail Cove
- 1303 Woodland Ct Unit 201
- 1303 Woodland Ct
- 503 Hidden Meadow Way Unit 10
- 503 Hidden Meadow Way