Estimated Value: $222,000 - $322,000
3
Beds
2
Baths
1,456
Sq Ft
$179/Sq Ft
Est. Value
About This Home
This home is located at 464 Sample Bridge Rd, Enola, PA 17025 and is currently estimated at $261,198, approximately $179 per square foot. 464 Sample Bridge Rd is a home located in Cumberland County with nearby schools including Green Ridge Elementary School, Eagle View Middle School, and Cumberland Valley High School.
Ownership History
Date
Name
Owned For
Owner Type
Purchase Details
Closed on
Oct 2, 2023
Sold by
Tracey Kimberly
Bought by
Conrady Jeffrey L and Conrady Lois Robinson
Current Estimated Value
Purchase Details
Closed on
Jun 19, 2015
Sold by
Laukemann Exr Theodore E and Est Of Theodore E Laukemann Jr
Bought by
Tracey Kimberly
Purchase Details
Closed on
Dec 22, 2014
Sold by
Laukemann Theodore E
Bought by
Laukemann Theodore E and Tracey Kimberly
Purchase Details
Closed on
Feb 16, 2011
Sold by
Sovereign Bank
Bought by
Laukemann Theodore E
Purchase Details
Closed on
Jun 27, 2003
Sold by
Rickrode Steven
Bought by
Shindel Joshua
Home Financials for this Owner
Home Financials are based on the most recent Mortgage that was taken out on this home.
Original Mortgage
$119,900
Interest Rate
5.53%
Mortgage Type
New Conventional
Create a Home Valuation Report for This Property
The Home Valuation Report is an in-depth analysis detailing your home's value as well as a comparison with similar homes in the area
Home Values in the Area
Average Home Value in this Area
Purchase History
| Date | Buyer | Sale Price | Title Company |
|---|---|---|---|
| Conrady Jeffrey L | $210,000 | None Listed On Document | |
| Tracey Kimberly | -- | -- | |
| Laukemann Theodore E | -- | -- | |
| Laukemann Theodore E | $65,000 | -- | |
| Shindel Joshua | $119,900 | -- |
Source: Public Records
Mortgage History
| Date | Status | Borrower | Loan Amount |
|---|---|---|---|
| Previous Owner | Shindel Joshua | $119,900 |
Source: Public Records
Tax History Compared to Growth
Tax History
| Year | Tax Paid | Tax Assessment Tax Assessment Total Assessment is a certain percentage of the fair market value that is determined by local assessors to be the total taxable value of land and additions on the property. | Land | Improvement |
|---|---|---|---|---|
| 2025 | $1,981 | $122,900 | $65,000 | $57,900 |
| 2024 | $1,884 | $122,900 | $65,000 | $57,900 |
| 2023 | $1,789 | $122,900 | $65,000 | $57,900 |
| 2022 | $1,745 | $122,900 | $65,000 | $57,900 |
| 2021 | $1,707 | $122,900 | $65,000 | $57,900 |
| 2020 | $1,676 | $122,900 | $65,000 | $57,900 |
| 2019 | $1,648 | $122,900 | $65,000 | $57,900 |
| 2018 | $1,620 | $122,900 | $65,000 | $57,900 |
| 2017 | $1,591 | $122,900 | $65,000 | $57,900 |
| 2016 | -- | $122,900 | $65,000 | $57,900 |
| 2015 | -- | $122,900 | $65,000 | $57,900 |
| 2014 | -- | $122,900 | $65,000 | $57,900 |
Source: Public Records
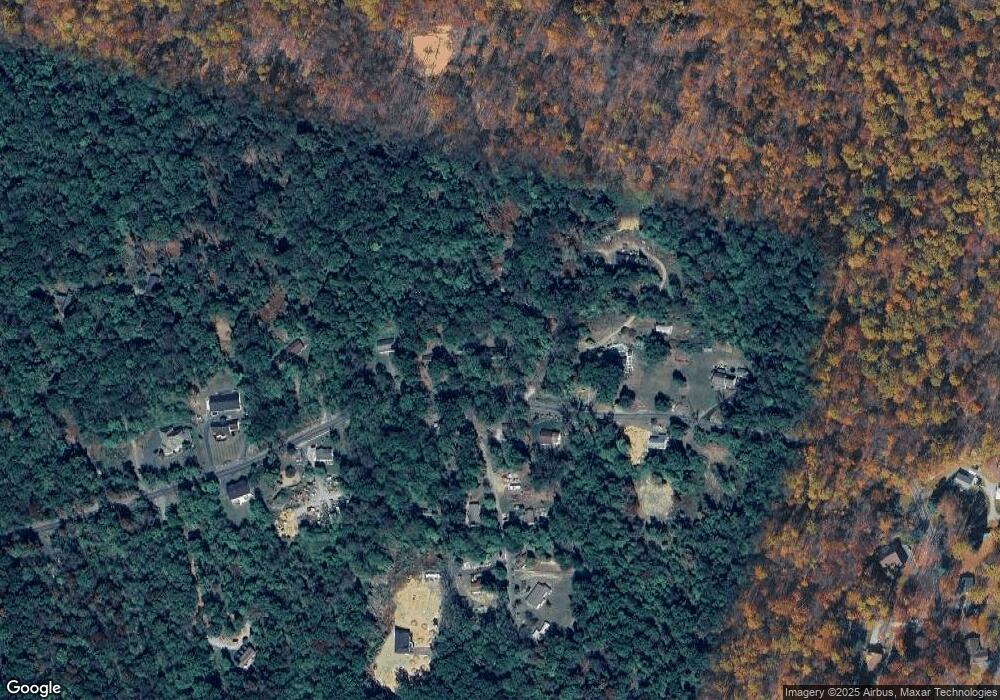
Map
Nearby Homes
- 481 Sample Bridge Rd
- 12 Sagecrest Cir
- 7 Oak Ln
- 482 Sample Bridge Rd
- 93 Beard Rd
- 10 Sailfish Dr
- 11 Sailfish Dr
- 9 Sailfish Dr
- 18 Rycroft Rd
- 20 Rycroft Rd
- 19 Rycroft Rd
- 5940 Huntington Commons
- 5960 Huntington Commons
- 47 Braxton Rd
- 48 Braxton Rd
- 7 Braxton Road Lot#56
- 5 Braxton Road Lot#57
- 1955 Dawn Rd
- 22 Blue Mountain Vista
- Lot 7 Signal Hill Dr
- 462 Sample Bridge Rd
- 461 Sample Bridge Rd
- 470 Sample Bridge Rd
- 1 Sportsman Rd
- 3 Doe Rd
- 6 Sportsman Rd
- 8 Sportsman Rd
- 456 Sample Bridge Rd
- 475 Sample Bridge Rd
- 474 Sample Bridge Rd
- 452 Sample Bridge Rd
- 7 Doe Rd
- 5 Sportsman Rd
- 478 Sample Bridge Rd
- 12 Sportsman Rd
- 480A Sample Bridge Rd
- 480 Sample Bridge Rd
- 487 Sample Bridge Rd
- 483 Sample Bridge Rd
- 433 Sample Bridge Rd