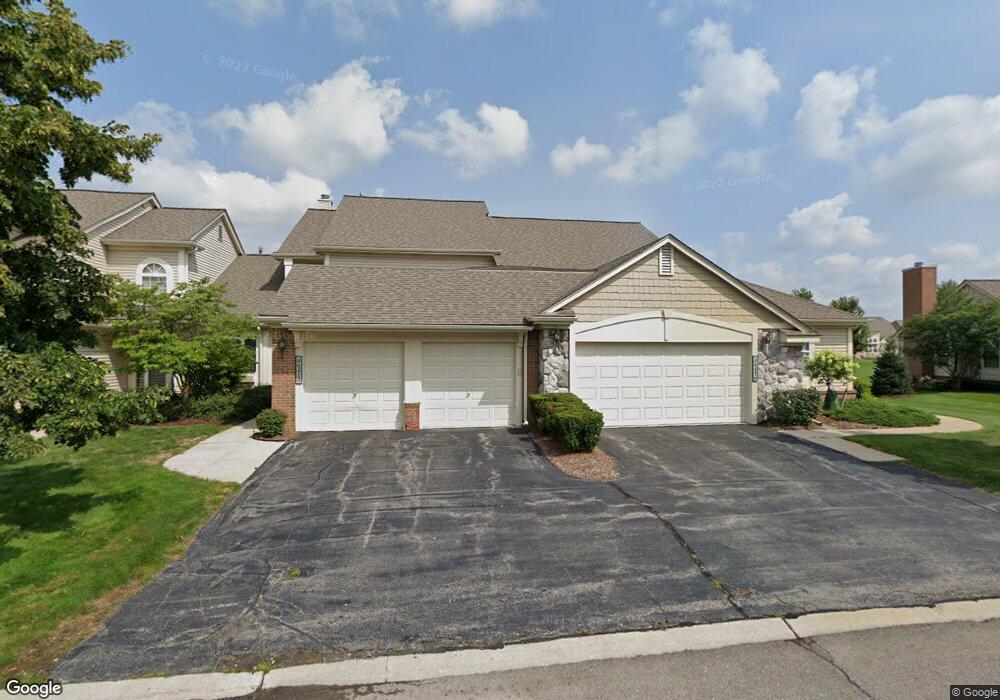
46416 Killarney Cir Unit 43, 145 Canton, MI 48188
Estimated Value: $393,000 - $433,000
Studio
2
Baths
1,826
Sq Ft
$222/Sq Ft
Est. Value
About This Home
This home is located at 46416 Killarney Cir Unit 43, 145, Canton, MI 48188 and is currently estimated at $405,932, approximately $222 per square foot. 46416 Killarney Cir Unit 43, 145 is a home located in Wayne County with nearby schools including Bentley Elementary School, Canton High School, and Plymouth High School.
Ownership History
Date
Name
Owned For
Owner Type
Purchase Details
Closed on
Aug 31, 2021
Sold by
Setman George
Bought by
Dusek Glenn Earl and Dusek Lauralyn
Current Estimated Value
Home Financials for this Owner
Home Financials are based on the most recent Mortgage that was taken out on this home.
Original Mortgage
$170,000
Outstanding Balance
$154,456
Interest Rate
2.7%
Mortgage Type
New Conventional
Estimated Equity
$251,476
Purchase Details
Closed on
Jan 18, 2016
Sold by
Nizami Investments Llc
Bought by
Setman George
Purchase Details
Closed on
Jan 14, 2016
Sold by
Nizami Imran Yaqoob and Nizami Iram
Bought by
Nizami Investments Llc
Purchase Details
Closed on
Aug 15, 2012
Sold by
Nizami Imran
Bought by
Nizami Investments Llc
Purchase Details
Closed on
Oct 28, 2011
Sold by
Thomas Woodie R and Thomas Jeanette E
Bought by
Nizami Imran Yaqoob and Nizami Iram
Create a Home Valuation Report for This Property
The Home Valuation Report is an in-depth analysis detailing your home's value as well as a comparison with similar homes in the area
Home Values in the Area
Average Home Value in this Area
Purchase History
| Date | Buyer | Sale Price | Title Company |
|---|---|---|---|
| Dusek Glenn Earl | $355,000 | Ata National Title Group Llc | |
| Setman George | $215,000 | Stg | |
| Nizami Investments Llc | -- | First Centennial Title | |
| Nizami Investments Llc | $170,000 | None Available | |
| Nizami Imran Yaqoob | $170,000 | Title One Inc |
Source: Public Records
Mortgage History
| Date | Status | Borrower | Loan Amount |
|---|---|---|---|
| Open | Dusek Glenn Earl | $170,000 |
Source: Public Records
Tax History
| Year | Tax Paid | Tax Assessment Tax Assessment Total Assessment is a certain percentage of the fair market value that is determined by local assessors to be the total taxable value of land and additions on the property. | Land | Improvement |
|---|---|---|---|---|
| 2025 | $3,020 | $187,500 | $0 | $0 |
| 2024 | $2,934 | $173,600 | $0 | $0 |
| 2023 | $2,797 | $157,500 | $0 | $0 |
| 2022 | $6,066 | $147,500 | $0 | $0 |
| 2021 | $7,980 | $142,700 | $0 | $0 |
| 2020 | $7,880 | $137,000 | $0 | $0 |
| 2019 | $7,735 | $134,930 | $0 | $0 |
| 2018 | $2,234 | $126,810 | $0 | $0 |
| 2017 | $5,542 | $125,400 | $0 | $0 |
| 2016 | $3,948 | $126,700 | $0 | $0 |
| 2015 | $9,848 | $116,280 | $0 | $0 |
| 2013 | $9,540 | $99,570 | $0 | $0 |
| 2010 | -- | $94,370 | $42,000 | $52,370 |
Source: Public Records
Map
Nearby Homes
- 1752 Thistle Dr
- 46501 Killarney Cir
- 345 Canton Center Rd
- 1849 Wentworth Ct
- 2210 Woodmont Dr W
- 0 Haggerty Unit 23129906
- 49963 Kent Ct
- 44125 Michigan Ave
- 49976 Kent Ct
- 49937 Kent Ct
- 46000 Geddes Rd Unit 483
- 46000 Geddes Rd Unit 378
- 46000 Geddes Rd Unit 424
- 46000 Geddes Rd
- 46000 Geddes Rd Unit 356
- 46000 Geddes Rd Unit 522
- 46000 Geddes Rd Unit 117
- 46000 Geddes Rd Unit 536
- 46000 Geddes Rd Unit 530
- 46000 Geddes Rd Unit 372
- 46416 Killarney Cir
- 46416 Killarney Cir Unit 145
- 46414 Killarney Cir
- 46412 Killarney Cir
- 46408 Killarney Cir
- 46424 Killarney Cir Unit 147
- 46426 Killarney Cir
- 46428 Killarney Cir
- 46433 Killarney Cir
- 46429 Killarney Cir
- 46429 Killarney Cir Unit 152
- 1729 Wentworth Dr Unit 96
- 1725 Wentworth Dr
- 46437 Killarney Cir
- 1719 Wentworth Dr
- 46409 Killarney Cir Unit 157
- 51278 Gulfstream Park Ln
- 51278 Gulfstream Park Ln
- 51227 Gulfstream Park Ln
- 51206 Gulfstream Park Ln
Your Personal Tour Guide
Ask me questions while you tour the home.