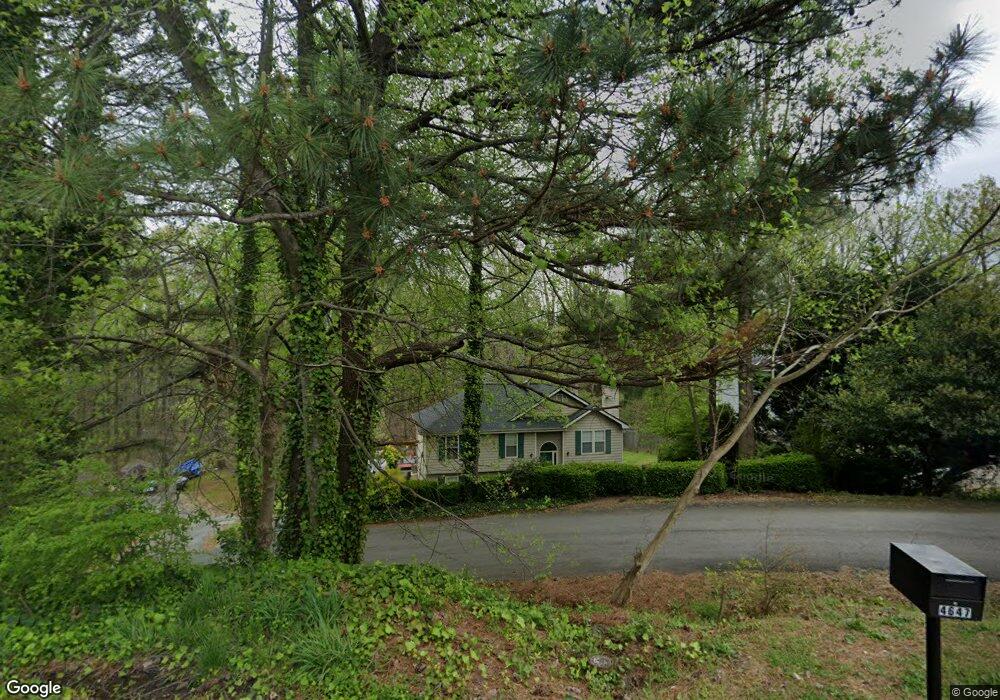
4642 Laurel Brook Dr Flowery Branch, GA 30542
Estimated Value: $254,000 - $325,377
3
Beds
2
Baths
1,212
Sq Ft
$241/Sq Ft
Est. Value
About This Home
This home is located at 4642 Laurel Brook Dr, Flowery Branch, GA 30542 and is currently estimated at $292,594, approximately $241 per square foot. 4642 Laurel Brook Dr is a home located in Hall County with nearby schools including Martin Elementary School, Southwest Middle School, and C.W. Davis Middle School.
Ownership History
Date
Name
Owned For
Owner Type
Purchase Details
Closed on
Sep 18, 2009
Sold by
Federal Home Loan Mortgage Corporation
Bought by
Herndon Max
Current Estimated Value
Home Financials for this Owner
Home Financials are based on the most recent Mortgage that was taken out on this home.
Original Mortgage
$95,243
Outstanding Balance
$62,035
Interest Rate
5.11%
Mortgage Type
FHA
Estimated Equity
$230,559
Purchase Details
Closed on
Apr 7, 2009
Sold by
Wells Fargo Bank Na
Bought by
Federal Home Loan Mortgage Corporation
Purchase Details
Closed on
Mar 31, 1994
Sold by
R M Devel Inc
Bought by
Boles Mark Lisa
Home Financials for this Owner
Home Financials are based on the most recent Mortgage that was taken out on this home.
Original Mortgage
$73,055
Interest Rate
7.47%
Create a Home Valuation Report for This Property
The Home Valuation Report is an in-depth analysis detailing your home's value as well as a comparison with similar homes in the area
Home Values in the Area
Average Home Value in this Area
Purchase History
| Date | Buyer | Sale Price | Title Company |
|---|---|---|---|
| Herndon Max | -- | -- | |
| Federal Home Loan Mortgage Corporation | -- | -- | |
| Wells Fargo Bank Na | $115,000 | -- | |
| Boles Mark Lisa | $76,900 | -- |
Source: Public Records
Mortgage History
| Date | Status | Borrower | Loan Amount |
|---|---|---|---|
| Open | Herndon Max | $95,243 | |
| Previous Owner | Boles Mark Lisa | $73,055 |
Source: Public Records
Tax History Compared to Growth
Tax History
| Year | Tax Paid | Tax Assessment Tax Assessment Total Assessment is a certain percentage of the fair market value that is determined by local assessors to be the total taxable value of land and additions on the property. | Land | Improvement |
|---|---|---|---|---|
| 2024 | $3,192 | $124,200 | $25,600 | $98,600 |
| 2023 | $3,212 | $124,840 | $25,600 | $99,240 |
| 2022 | $2,432 | $89,520 | $17,920 | $71,600 |
| 2021 | $2,264 | $81,400 | $16,640 | $64,760 |
| 2020 | $2,090 | $72,800 | $12,800 | $60,000 |
| 2019 | $1,802 | $61,560 | $11,240 | $50,320 |
| 2018 | $1,646 | $54,040 | $11,240 | $42,800 |
| 2017 | $1,496 | $49,280 | $11,240 | $38,040 |
| 2016 | $1,262 | $41,920 | $11,240 | $30,680 |
| 2015 | $966 | $30,843 | $5,080 | $25,763 |
| 2014 | $966 | $30,843 | $5,080 | $25,763 |
Source: Public Records
Map
Nearby Homes
- 4647 Laurel Brook Dr
- 7344 Rocklin Ln
- 5619 Chickory Dr Unit 126
- 5651 Chickory Dr Unit 118
- 4695 Eucalyptus Way
- 4947 Cash Rd
- 4827 Daintree Ct
- 4674 Quail Pointe Dr
- 4864 Grandview Ct
- 4860 Grandview Ct
- 4826 Rose Heights Dr
- 6151 Spout Springs Rd
- 5021 Limerick Ln
- 5059 Lancashire Ct
- 5513 Keswick Dr
- 0 Hog Mountain Rd Unit 9051064
- 5537 Keswick Dr
- 4636 Laurel Brook Dr
- 4646 Laurel Brook Dr
- 4630 Laurel Brook Dr
- 4652 Laurel Brook Dr
- 4624 Laurel Brook Dr
- 4635 Laurel Brook Dr
- 4641 Laurel Brook Dr
- 4623 Laurel Brook Dr
- 4649 Spring Ridge Dr
- 4631 Spring Ridge Dr
- 4618 Laurel Brook Dr
- 0 Laurel Brook Dr Unit 8897900
- 0 Laurel Brook Dr Unit 7426298
- 0 Laurel Brook Dr
- 4655 Spring Ridge Dr
- 4655 Spring Ridge Dr Unit 42
- 4637 Spring Ridge Dr
- 4625 Spring Ridge Dr
- 4617 Laurel Brook Dr
- 4667 Spring Ridge Dr