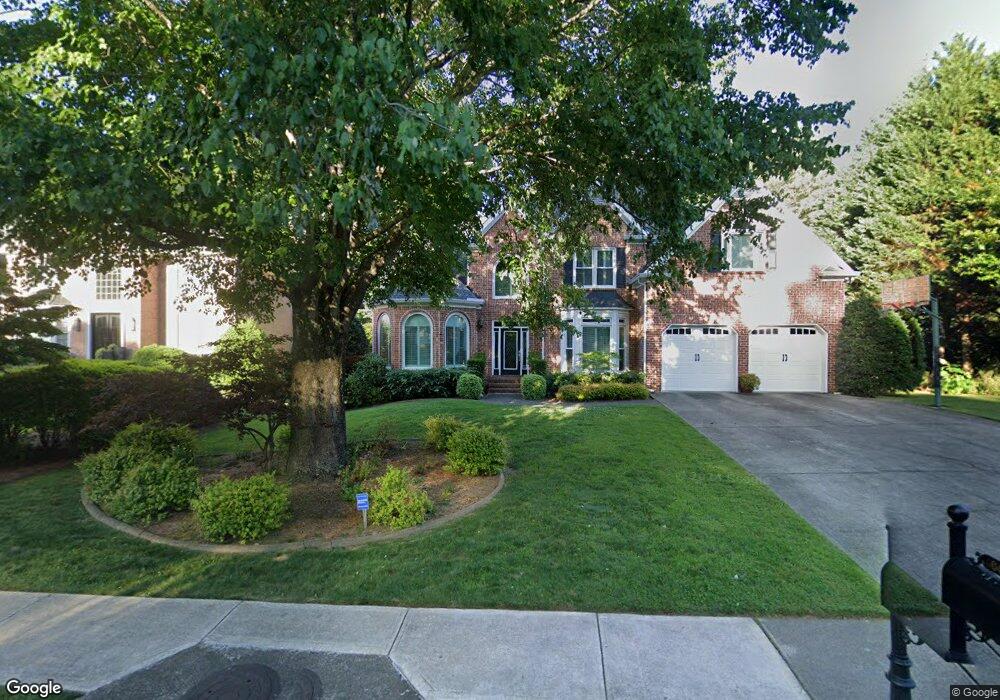
4643 Gilhams Rd NE Unit 1 Roswell, GA 30075
East Cobb NeighborhoodEstimated Value: $973,000 - $1,041,615
5
Beds
6
Baths
3,615
Sq Ft
$276/Sq Ft
Est. Value
About This Home
This home is located at 4643 Gilhams Rd NE Unit 1, Roswell, GA 30075 and is currently estimated at $998,654, approximately $276 per square foot. 4643 Gilhams Rd NE Unit 1 is a home located in Cobb County with nearby schools including Garrison Mill Elementary School, Mabry Middle School, and Lassiter High School.
Ownership History
Date
Name
Owned For
Owner Type
Purchase Details
Closed on
Jan 31, 2008
Sold by
Morgan Wanda G
Bought by
Larson Carter T and Larson Susan J
Current Estimated Value
Home Financials for this Owner
Home Financials are based on the most recent Mortgage that was taken out on this home.
Original Mortgage
$417,000
Outstanding Balance
$262,670
Interest Rate
6.12%
Mortgage Type
New Conventional
Estimated Equity
$735,984
Purchase Details
Closed on
Jan 29, 2003
Sold by
Kessel William B and Kessel Maria C
Bought by
Morgan Radcliff
Home Financials for this Owner
Home Financials are based on the most recent Mortgage that was taken out on this home.
Original Mortgage
$356,000
Interest Rate
6.4%
Mortgage Type
New Conventional
Purchase Details
Closed on
Feb 25, 2000
Sold by
Kgk Constructors Inc
Bought by
Kessel William B and Kessel Maria C
Home Financials for this Owner
Home Financials are based on the most recent Mortgage that was taken out on this home.
Original Mortgage
$270,434
Interest Rate
8.29%
Mortgage Type
New Conventional
Create a Home Valuation Report for This Property
The Home Valuation Report is an in-depth analysis detailing your home's value as well as a comparison with similar homes in the area
Home Values in the Area
Average Home Value in this Area
Purchase History
| Date | Buyer | Sale Price | Title Company |
|---|---|---|---|
| Larson Carter T | $530,000 | -- | |
| Morgan Radcliff | $445,000 | -- | |
| Kessel William B | $370,500 | -- |
Source: Public Records
Mortgage History
| Date | Status | Borrower | Loan Amount |
|---|---|---|---|
| Open | Larson Carter T | $417,000 | |
| Previous Owner | Morgan Radcliff | $356,000 | |
| Previous Owner | Kessel William B | $270,434 |
Source: Public Records
Tax History Compared to Growth
Tax History
| Year | Tax Paid | Tax Assessment Tax Assessment Total Assessment is a certain percentage of the fair market value that is determined by local assessors to be the total taxable value of land and additions on the property. | Land | Improvement |
|---|---|---|---|---|
| 2025 | $10,867 | $360,684 | $96,000 | $264,684 |
| 2024 | $10,013 | $332,100 | $84,000 | $248,100 |
| 2023 | $8,412 | $279,000 | $66,000 | $213,000 |
| 2022 | $8,468 | $279,000 | $66,000 | $213,000 |
| 2021 | $7,655 | $252,208 | $66,000 | $186,208 |
| 2020 | $7,655 | $252,208 | $66,000 | $186,208 |
| 2019 | $7,655 | $252,208 | $66,000 | $186,208 |
| 2018 | $7,655 | $252,208 | $66,000 | $186,208 |
| 2017 | $6,533 | $227,248 | $60,000 | $167,248 |
| 2016 | $5,923 | $206,020 | $52,000 | $154,020 |
| 2015 | $6,069 | $206,020 | $52,000 | $154,020 |
| 2014 | $6,121 | $206,020 | $0 | $0 |
Source: Public Records
Map
Nearby Homes
- 11140 West Rd
- 4587 Gilhams Rd NE
- 11180 West Rd
- 4579 Glenforest Dr NE
- 10955 Stroup Rd
- 11015 Stroup Rd
- 3865 Mabry Rd NE
- 3929 Fort Trail NE Unit 2
- 4440 Coventry Ct NE
- 3616 Hampstead Ln NE
- 11395 West Rd
- 4509 Bastion Dr
- 4505 Bastion Dr
- 3760 Loch Highland Pkwy NE
- 4363 Old Mabry Rd NE
- 4140 Westchester Crossing NE
- 1483 Jones Rd
- 4641 Gilhams Rd NE Unit I
- 4639 Gilhams Rd NE
- 4093 Tropez Place NE
- 4091 Tropez Place NE
- 4642 Gilhams Rd NE
- 4095 Tropez Place NE
- 4638 Gilhams Rd NE Unit 1
- 4640 Gilhams Rd NE Unit 1
- 4097 Tropez Place NE Unit 4
- 4097 Tropez Place NE
- 4637 Gilhams Rd NE
- 4755 Freeport Bay NE
- 4636 Gilhams Rd NE
- 4644 Gilhams Rd NE Unit 1
- 4634 Gilhams Rd NE Unit 1
- 0 Gilhams Rd Unit 7439572
- 0 Gilhams Rd Unit 7428675
- 0 Gilhams Rd Unit 7358533
- 0 Gilhams Rd Unit 7067978
- 0 Gilhams Rd Unit 7023404