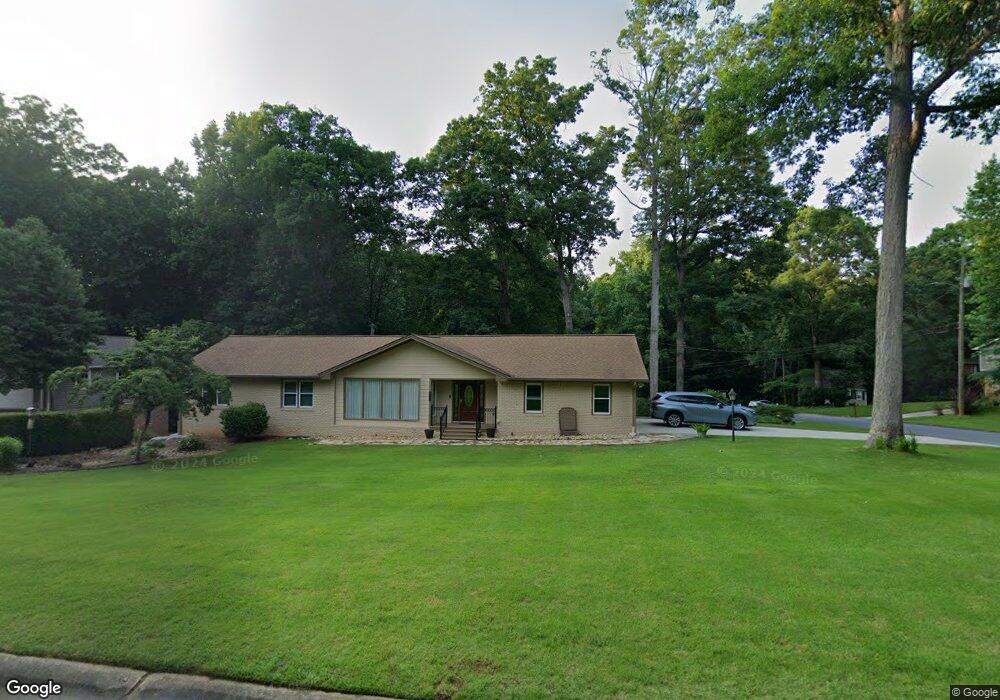
4643 Mountain Creek Dr NE Unit 3 Roswell, GA 30075
East Cobb NeighborhoodEstimated Value: $543,000 - $571,000
4
Beds
3
Baths
1,958
Sq Ft
$285/Sq Ft
Est. Value
About This Home
This home is located at 4643 Mountain Creek Dr NE Unit 3, Roswell, GA 30075 and is currently estimated at $557,593, approximately $284 per square foot. 4643 Mountain Creek Dr NE Unit 3 is a home located in Cobb County with nearby schools including Tritt Elementary School, Hightower Trail Middle School, and Pope High School.
Ownership History
Date
Name
Owned For
Owner Type
Purchase Details
Closed on
May 10, 2012
Sold by
Whitaker Roger Sherwood
Bought by
Whitaker Roger Sherwood Revoca and Whitaker Roberta Shirley Revoc
Current Estimated Value
Purchase Details
Closed on
Apr 3, 2000
Sold by
Carter Larry and Carter Helen
Bought by
Whitaker Roger S and Whitaker Robert A
Home Financials for this Owner
Home Financials are based on the most recent Mortgage that was taken out on this home.
Original Mortgage
$167,400
Interest Rate
8.2%
Mortgage Type
New Conventional
Purchase Details
Closed on
Sep 2, 1993
Sold by
True David W
Bought by
Carter Larry Helen
Home Financials for this Owner
Home Financials are based on the most recent Mortgage that was taken out on this home.
Original Mortgage
$54,750
Interest Rate
7.22%
Create a Home Valuation Report for This Property
The Home Valuation Report is an in-depth analysis detailing your home's value as well as a comparison with similar homes in the area
Home Values in the Area
Average Home Value in this Area
Purchase History
| Date | Buyer | Sale Price | Title Company |
|---|---|---|---|
| Whitaker Roger Sherwood Revoca | -- | -- | |
| Whitaker Roger S | $186,000 | -- | |
| Carter Larry Helen | $109,500 | -- |
Source: Public Records
Mortgage History
| Date | Status | Borrower | Loan Amount |
|---|---|---|---|
| Previous Owner | Whitaker Roger S | $167,400 | |
| Previous Owner | Carter Larry Helen | $54,750 |
Source: Public Records
Tax History Compared to Growth
Tax History
| Year | Tax Paid | Tax Assessment Tax Assessment Total Assessment is a certain percentage of the fair market value that is determined by local assessors to be the total taxable value of land and additions on the property. | Land | Improvement |
|---|---|---|---|---|
| 2025 | $1,140 | $188,804 | $48,000 | $140,804 |
| 2024 | $1,144 | $188,804 | $48,000 | $140,804 |
| 2023 | $915 | $181,316 | $44,000 | $137,316 |
| 2022 | $1,101 | $174,448 | $35,200 | $139,248 |
| 2021 | $1,018 | $146,796 | $35,200 | $111,596 |
| 2020 | $1,018 | $146,796 | $35,200 | $111,596 |
| 2019 | $1,018 | $146,796 | $35,200 | $111,596 |
| 2018 | $939 | $120,220 | $30,000 | $90,220 |
| 2017 | $834 | $120,220 | $30,000 | $90,220 |
| 2016 | $795 | $106,316 | $30,000 | $76,316 |
| 2015 | $793 | $90,048 | $24,000 | $66,048 |
| 2014 | $807 | $90,048 | $0 | $0 |
Source: Public Records
Map
Nearby Homes
- 4574 Woodland Cir NE
- 3025 Creek Ct NE
- 4618 Shallowford Rd
- 4486 Huffman Dr NE
- 4448 Huffman Dr NE
- 3226 Artessa Ln NE
- 2990 Mountain Trace NE
- 3231 Artessa Ln NE
- 3277 Artessa Ln NE
- 4645 Shallowford Rd
- 2993 Byrons Green Ct
- 4290 Freeman Rd
- 3333 Trails End Rd NE
- 2821 Interlaken Dr
- 2997 Gateland Square
- 2859 Tynewick Dr NE
- 1533 Tennessee Walker Dr NE
- 4641 Mountain Creek Dr NE
- 4647 Mountain Creek Dr NE
- 4639 Mountain Creek Dr NE Unit 3
- 3017 Mountain Creek Ct NE Unit 3
- 3012 Mountain Creek Ct NE
- 4644 Mountain Creek Dr NE
- 4642 Mountain Creek Dr NE
- 4640 Mountain Creek Dr NE
- 3024 Mountain Creek Ct NE
- 3025 Mountain Creek Ct NE Unit 3
- 4637 Mountain Creek Dr NE Unit 3
- 4648 Mountain Creek Dr NE
- 4638 Mountain Creek Dr NE
- 4638 Mountain Creek Dr NE Unit 39
- 2889 Clary Hill Dr NE
- 4650 Mountain Creek Dr NE Unit 3
- 2887 Clary Hill Dr NE
- 3015 Creek Ct NE
- 4635 Mountain Creek Dr NE
- 3003 Creek Ct NE