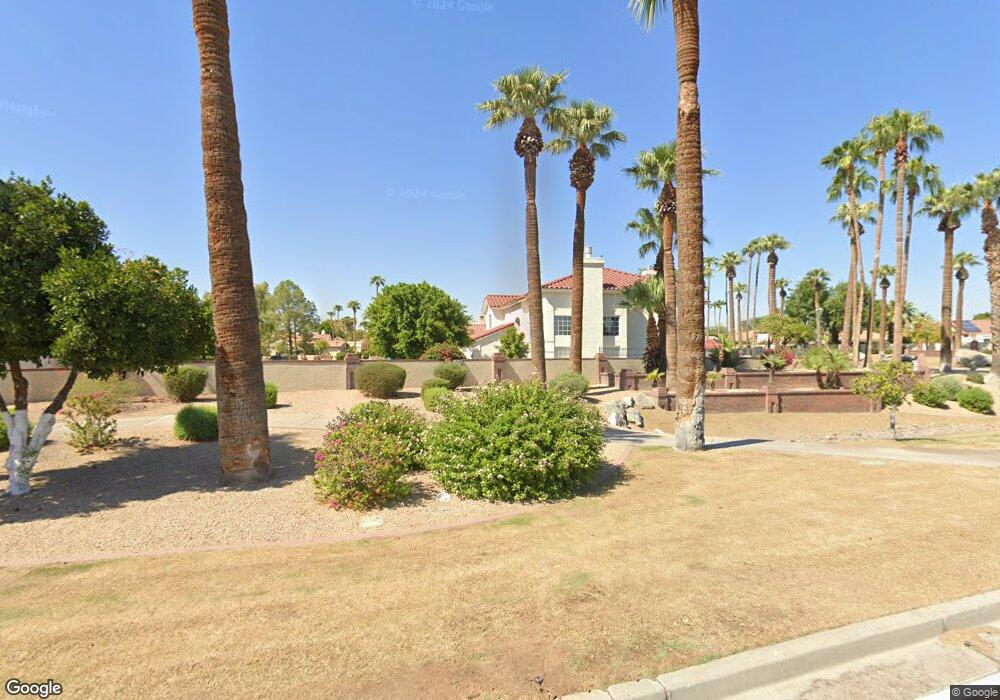
4643 N Desert Stream Way Litchfield Park, AZ 85340
Estimated Value: $419,516 - $534,000
--
Bed
3
Baths
1,792
Sq Ft
$279/Sq Ft
Est. Value
About This Home
This home is located at 4643 N Desert Stream Way, Litchfield Park, AZ 85340 and is currently estimated at $500,129, approximately $279 per square foot. 4643 N Desert Stream Way is a home located in Maricopa County with nearby schools including Litchfield Elementary School, Western Sky Middle School, and St. Peter's Montessori School.
Ownership History
Date
Name
Owned For
Owner Type
Purchase Details
Closed on
Mar 17, 2010
Sold by
Bagby Marilla B
Bought by
Bagby Frederick L and Mbb Qualified Personal Residence Trust
Current Estimated Value
Purchase Details
Closed on
Mar 20, 2001
Sold by
Snow Willard Sterling and Snow Barbara Kay
Bought by
Bagby Frederick L and Bagby Marilla B
Home Financials for this Owner
Home Financials are based on the most recent Mortgage that was taken out on this home.
Original Mortgage
$155,800
Outstanding Balance
$57,028
Interest Rate
7.09%
Mortgage Type
New Conventional
Estimated Equity
$443,101
Purchase Details
Closed on
Oct 2, 1995
Sold by
Howard David W
Bought by
Snow Willard Sterling and Snow Barbara Kay
Home Financials for this Owner
Home Financials are based on the most recent Mortgage that was taken out on this home.
Original Mortgage
$100,000
Interest Rate
7.47%
Mortgage Type
New Conventional
Create a Home Valuation Report for This Property
The Home Valuation Report is an in-depth analysis detailing your home's value as well as a comparison with similar homes in the area
Home Values in the Area
Average Home Value in this Area
Purchase History
| Date | Buyer | Sale Price | Title Company |
|---|---|---|---|
| Bagby Frederick L | -- | None Available | |
| Bagby Marilla B | -- | None Available | |
| Bagby Frederick L | $164,000 | Security Title Agency | |
| Snow Willard Sterling | $164,000 | Security Title Agency |
Source: Public Records
Mortgage History
| Date | Status | Borrower | Loan Amount |
|---|---|---|---|
| Open | Bagby Frederick L | $155,800 | |
| Previous Owner | Snow Willard Sterling | $100,000 |
Source: Public Records
Tax History Compared to Growth
Tax History
| Year | Tax Paid | Tax Assessment Tax Assessment Total Assessment is a certain percentage of the fair market value that is determined by local assessors to be the total taxable value of land and additions on the property. | Land | Improvement |
|---|---|---|---|---|
| 2025 | $1,676 | $22,064 | -- | -- |
| 2024 | $1,564 | $21,013 | -- | -- |
| 2023 | $1,564 | $33,010 | $6,600 | $26,410 |
| 2022 | $1,508 | $25,510 | $5,100 | $20,410 |
| 2021 | $1,627 | $23,480 | $4,690 | $18,790 |
| 2020 | $1,578 | $21,810 | $4,360 | $17,450 |
| 2019 | $1,528 | $20,820 | $4,160 | $16,660 |
| 2018 | $1,497 | $20,130 | $4,020 | $16,110 |
| 2017 | $1,408 | $18,900 | $3,780 | $15,120 |
| 2016 | $1,356 | $16,950 | $3,390 | $13,560 |
| 2015 | $1,263 | $14,550 | $2,910 | $11,640 |
Source: Public Records
Map
Nearby Homes
- 4738 N Greenview Cir W
- 6305 N Litchfield Rd Unit 142
- 14123 W Greentree Dr S
- 4510 N Bent Tree Cir W
- 14209 W Valley View Dr
- 315 W Llano Dr
- 460 E Estero Ln
- 5065 N 145th Dr
- 14200 W Village Pkwy Unit 2263
- 14200 W Village Pkwy Unit 2046
- 14200 W Village Pkwy Unit 132
- 14200 W Village Pkwy Unit 2276
- 14200 W Village Pkwy Unit 2128
- 540 E Cercado Ln
- 815 W Juniper Ln Unit 178
- 14640 W Hidden Terrace Loop
- 14590 W Pasadena Ave
- 14659 W Hidden Terrace Loop
- 14250 W Wigwam Blvd Unit 2022
- 14250 W Wigwam Blvd Unit 2624
- 4647 N Desert Stream Way
- 4639 N Desert Stream Way
- 4651 N Desert Stream Way
- 4635 N Desert Stream Way
- 4624 N Desert Stream Way
- 4701 N Brookview Terrace
- 4647 N Clear Creek Dr
- 4620 N Desert Stream Way
- 4711 N Litchfield Knoll S
- 4705 N Brookview Terrace
- 4707 N Litchfield Knoll S
- 4707 N Litchfield Knoll E
- 4702 N Brookview Terrace
- 4709 N Brookview Terrace
- 4614 N Desert Stream Way
- 4612 N Desert Stream Way
- 4610 N Desert Stream Way
- 4608 N Desert Stream Way
- 4639 N Clear Creek Dr
- 4728 N Greentree Dr E