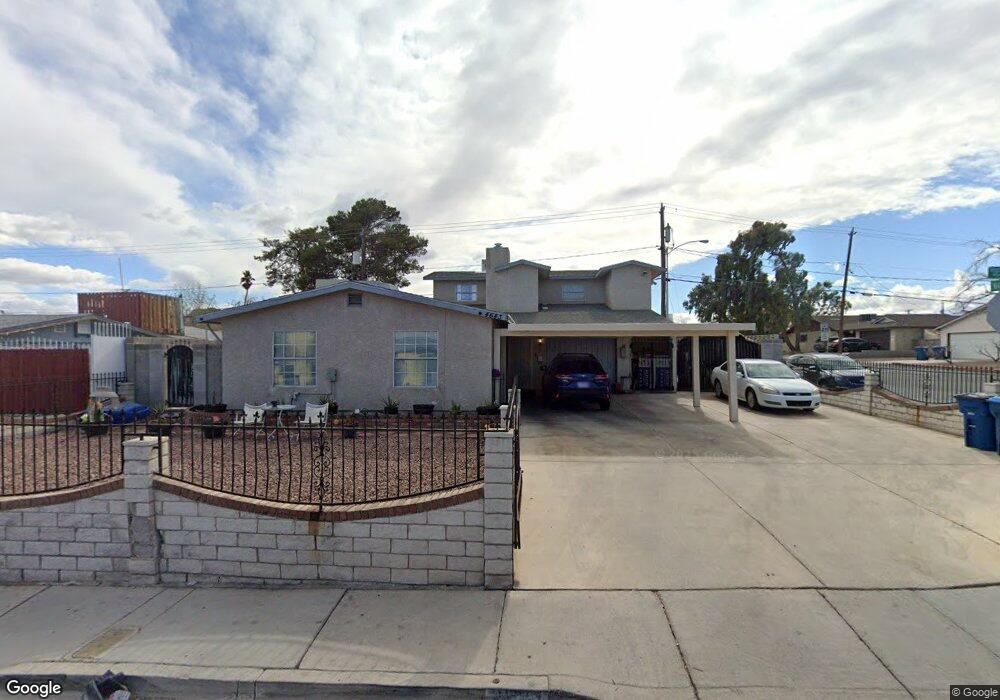
4643 W Desert Inn Rd Las Vegas, NV 89102
Chinatown NeighborhoodEstimated Value: $424,819 - $474,000
4
Beds
4
Baths
2,308
Sq Ft
$195/Sq Ft
Est. Value
About This Home
This home is located at 4643 W Desert Inn Rd, Las Vegas, NV 89102 and is currently estimated at $451,205, approximately $195 per square foot. 4643 W Desert Inn Rd is a home located in Clark County with nearby schools including Rex Bell Elementary School, James Cashman Middle School, and Ed W Clark High School.
Ownership History
Date
Name
Owned For
Owner Type
Purchase Details
Closed on
Apr 10, 2023
Sold by
Anne Slack Separate Property Trust
Bought by
Anne Slack Separate Property Trust
Current Estimated Value
Purchase Details
Closed on
May 5, 2020
Sold by
Stack Anne and Anne Stack Separate Property T
Bought by
Stack Anne and Anne A Slack Separate Property
Purchase Details
Closed on
Sep 10, 2011
Sold by
Slack Anne
Bought by
Slack Anne A and Anne Slack Separate Property Trust
Purchase Details
Closed on
May 21, 2009
Sold by
Slack Anne A
Bought by
Slack Anne A
Home Financials for this Owner
Home Financials are based on the most recent Mortgage that was taken out on this home.
Original Mortgage
$120,000
Interest Rate
4.8%
Mortgage Type
New Conventional
Purchase Details
Closed on
Nov 16, 2006
Sold by
Slack Anne A
Bought by
Slack Anne A and Anne Slack Separate Property Trust
Purchase Details
Closed on
Feb 4, 1999
Sold by
Slack Elwin C and Slack Anne A
Bought by
Slack Anne A
Home Financials for this Owner
Home Financials are based on the most recent Mortgage that was taken out on this home.
Original Mortgage
$89,600
Interest Rate
6.79%
Create a Home Valuation Report for This Property
The Home Valuation Report is an in-depth analysis detailing your home's value as well as a comparison with similar homes in the area
Home Values in the Area
Average Home Value in this Area
Purchase History
| Date | Buyer | Sale Price | Title Company |
|---|---|---|---|
| Anne Slack Separate Property Trust | -- | None Listed On Document | |
| Stack Anne | -- | None Available | |
| Slack Anne A | -- | None Available | |
| Slack Anne A | -- | Nevada Title Las Vegas | |
| Slack Anne A | -- | None Available | |
| Slack Anne A | -- | Nevada Title Company |
Source: Public Records
Mortgage History
| Date | Status | Borrower | Loan Amount |
|---|---|---|---|
| Previous Owner | Slack Anne A | $120,000 | |
| Previous Owner | Slack Anne A | $89,600 |
Source: Public Records
Tax History Compared to Growth
Tax History
| Year | Tax Paid | Tax Assessment Tax Assessment Total Assessment is a certain percentage of the fair market value that is determined by local assessors to be the total taxable value of land and additions on the property. | Land | Improvement |
|---|---|---|---|---|
| 2025 | $1,661 | $72,554 | $33,250 | $39,304 |
| 2024 | $1,613 | $72,554 | $33,250 | $39,304 |
| 2023 | $1,613 | $71,808 | $33,250 | $38,558 |
| 2022 | $1,566 | $59,140 | $23,450 | $35,690 |
| 2021 | $1,521 | $55,538 | $21,000 | $34,538 |
| 2020 | $1,526 | $55,918 | $21,000 | $34,918 |
| 2019 | $1,431 | $52,303 | $17,500 | $34,803 |
| 2018 | $1,389 | $49,027 | $15,400 | $33,627 |
| 2017 | $1,462 | $49,835 | $15,400 | $34,435 |
| 2016 | $1,316 | $44,998 | $9,450 | $35,548 |
| 2015 | $1,313 | $44,263 | $8,750 | $35,513 |
| 2014 | $1,274 | $42,158 | $6,300 | $35,858 |
Source: Public Records
Map
Nearby Homes
- 4533 W Desert Inn Rd
- 3262 Jericho St Unit B
- 4730 S Pioneer Ave
- 3253 Savalli St Unit D
- 4530 Sparky Dr Unit A
- 4461 Rich Dr Unit B
- 4461 Rich Dr Unit D
- 4451 Rich Dr Unit D
- 4504 Del Oro Dr
- 4440 Rich Dr Unit D
- 4501 Buena Vista Dr
- 5006 Schumann Dr
- 5030 Schumann Dr
- 3217 Arville St
- 3142 Juanita Dr
- 3214 Anacapa Way
- 5191 Pioneer Ave Unit 101
- 3641 Ala Dr
- 5151 Golden Spring Ave
- 3585 Arville St Unit 403A
- 4633 W Desert Inn Rd
- 4642 Scott Ave
- 4632 Scott Ave
- 4623 W Desert Inn Rd
- 3315 Warnock Rd
- 4622 Scott Ave
- 3325 Warnock Rd
- 4613 W Desert Inn Rd
- 4612 Scott Ave
- 3347 Warnock Rd
- 3368 Warnock Rd
- 4603 W Desert Inn Rd
- 4785 W Desert Inn Rd
- 4602 Scott Ave
- 4627 Scott Ave
- 4617 Scott Ave Unit N
- 4617 Scott Ave
- 4593 W Desert Inn Rd
- 3378 Warnock Rd
- 4592 Scott Ave