Estimated Value: $452,401 - $487,000
3
Beds
1
Bath
1,472
Sq Ft
$320/Sq Ft
Est. Value
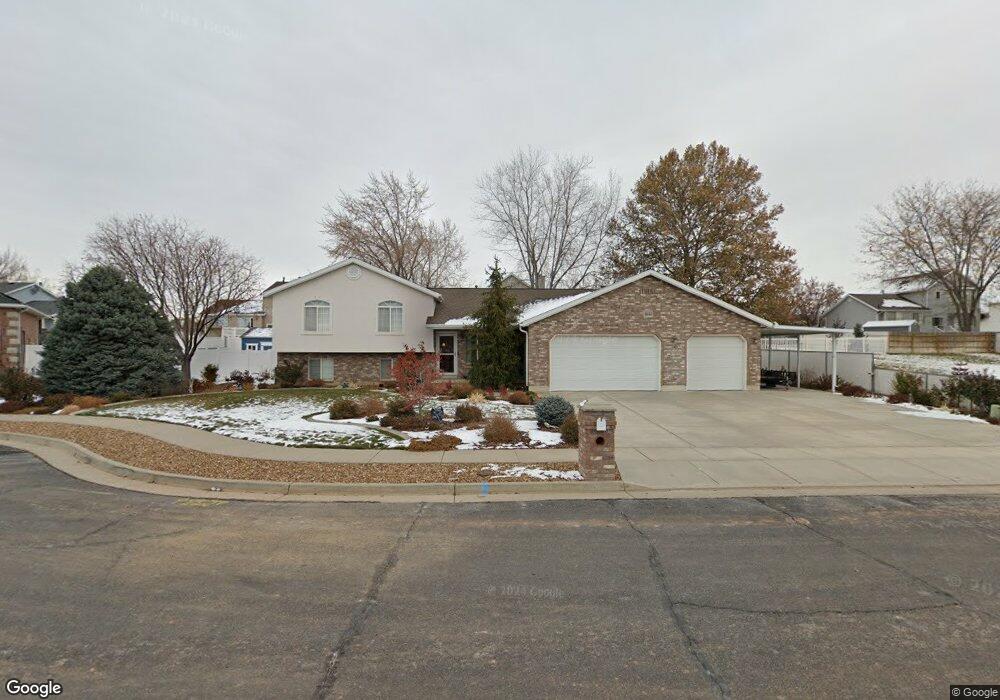
About This Home
This home is located at 4644 S 2950 W, Roy, UT 84067 and is currently estimated at $471,100, approximately $320 per square foot. 4644 S 2950 W is a home located in Weber County with nearby schools including Midland School, Sand Ridge Junior High School, and Roy High School.
Ownership History
Date
Name
Owned For
Owner Type
Purchase Details
Closed on
Mar 20, 2001
Sold by
Micott Homes Inc
Bought by
Allman Tony R and Allman Renee J
Current Estimated Value
Home Financials for this Owner
Home Financials are based on the most recent Mortgage that was taken out on this home.
Original Mortgage
$175,440
Outstanding Balance
$63,644
Interest Rate
6.97%
Mortgage Type
VA
Estimated Equity
$407,456
Purchase Details
Closed on
Aug 18, 1999
Sold by
Sandoval Luis O
Bought by
Micott Homes Inc
Create a Home Valuation Report for This Property
The Home Valuation Report is an in-depth analysis detailing your home's value as well as a comparison with similar homes in the area
Home Values in the Area
Average Home Value in this Area
Purchase History
| Date | Buyer | Sale Price | Title Company |
|---|---|---|---|
| Allman Tony R | -- | Cardon Metro Title Company | |
| Micott Homes Inc | -- | Bonneville Title Company |
Source: Public Records
Mortgage History
| Date | Status | Borrower | Loan Amount |
|---|---|---|---|
| Open | Allman Tony R | $175,440 |
Source: Public Records
Tax History
| Year | Tax Paid | Tax Assessment Tax Assessment Total Assessment is a certain percentage of the fair market value that is determined by local assessors to be the total taxable value of land and additions on the property. | Land | Improvement |
|---|---|---|---|---|
| 2025 | $272 | $460,665 | $146,404 | $314,261 |
| 2024 | $265 | $249,149 | $80,522 | $168,627 |
| 2023 | $257 | $254,650 | $74,205 | $180,445 |
| 2022 | $1,048 | $251,350 | $62,756 | $188,594 |
| 2021 | $554 | $357,000 | $88,036 | $268,964 |
| 2020 | $197 | $293,000 | $88,036 | $204,964 |
| 2019 | $196 | $287,000 | $52,408 | $234,592 |
| 2018 | $195 | $263,000 | $48,259 | $214,741 |
| 2017 | $194 | $230,000 | $48,259 | $181,741 |
| 2016 | $191 | $116,847 | $25,268 | $91,579 |
| 2015 | $188 | $102,572 | $25,268 | $77,304 |
| 2014 | $186 | $101,067 | $25,268 | $75,799 |
Source: Public Records
Map
Nearby Homes
- 2953 W 4650 S
- 3022 W 4750 S
- 4793 S 3025 W
- 4732 S West Park Dr
- 4891 S 2875 W
- 2602 W 4600 S
- 4374 S 2900 W
- 2817 W 5000 S
- 5009 S 2925 W
- 2815 W 4275 S
- 2979 W 4275 S
- 5063 S 2825 W
- 4270 S 2900 W
- 4510 Stone Creek Rd Unit F
- 4435 Cross Creek Rd Unit 29C
- 4491 Haven Creek Rd Unit A
- 2581 W 5000 S
- 5141 S 2975 W
- 3405 W 4525 S
- 4881 S 2400 W
Your Personal Tour Guide
Ask me questions while you tour the home.