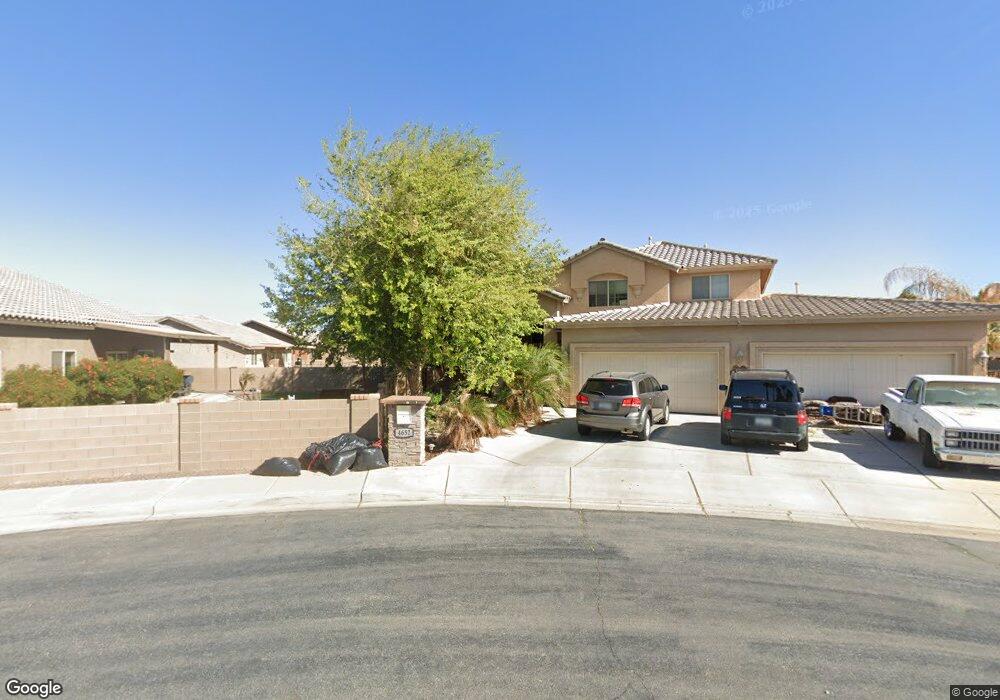
4644 W 23rd Ln Unit 7 Yuma, AZ 85364
Falls Ranch NeighborhoodEstimated Value: $480,750 - $522,000
4
Beds
2
Baths
2,302
Sq Ft
$218/Sq Ft
Est. Value
About This Home
This home is located at 4644 W 23rd Ln Unit 7, Yuma, AZ 85364 and is currently estimated at $502,188, approximately $218 per square foot. 4644 W 23rd Ln Unit 7 is a home located in Yuma County with nearby schools including Valley Horizon Elementary School, Crane Middle School, and Cibola High School.
Ownership History
Date
Name
Owned For
Owner Type
Purchase Details
Closed on
Mar 29, 2010
Sold by
Zanutto Michael R and Zanutto Luccy Y
Bought by
Harmoney Jason and Harmoney Jenica
Current Estimated Value
Home Financials for this Owner
Home Financials are based on the most recent Mortgage that was taken out on this home.
Original Mortgage
$212,901
Interest Rate
4.72%
Mortgage Type
VA
Purchase Details
Closed on
Aug 9, 2007
Sold by
Lee Homes Llc
Bought by
Zanutto Michael R and Zanutto Luccy Y
Home Financials for this Owner
Home Financials are based on the most recent Mortgage that was taken out on this home.
Original Mortgage
$344,155
Interest Rate
6.67%
Mortgage Type
VA
Create a Home Valuation Report for This Property
The Home Valuation Report is an in-depth analysis detailing your home's value as well as a comparison with similar homes in the area
Home Values in the Area
Average Home Value in this Area
Purchase History
| Date | Buyer | Sale Price | Title Company |
|---|---|---|---|
| Harmoney Jason | $206,100 | Fidelity National Title | |
| Zanutto Michael R | $333,000 | First American |
Source: Public Records
Mortgage History
| Date | Status | Borrower | Loan Amount |
|---|---|---|---|
| Previous Owner | Harmoney Jason | $212,901 | |
| Previous Owner | Zanutto Michael R | $344,155 |
Source: Public Records
Tax History Compared to Growth
Tax History
| Year | Tax Paid | Tax Assessment Tax Assessment Total Assessment is a certain percentage of the fair market value that is determined by local assessors to be the total taxable value of land and additions on the property. | Land | Improvement |
|---|---|---|---|---|
| 2025 | $3,495 | $32,796 | $6,667 | $26,129 |
| 2024 | $3,327 | $31,234 | $6,542 | $24,692 |
| 2023 | $3,327 | $29,746 | $5,962 | $23,784 |
| 2022 | $3,241 | $28,330 | $6,013 | $22,317 |
| 2021 | $3,415 | $26,981 | $6,156 | $20,825 |
| 2020 | $3,316 | $25,696 | $5,847 | $19,849 |
| 2019 | $3,261 | $24,473 | $5,486 | $18,987 |
| 2018 | $3,016 | $23,307 | $5,267 | $18,040 |
| 2017 | $2,955 | $23,307 | $5,267 | $18,040 |
| 2016 | $2,636 | $19,637 | $5,541 | $14,096 |
| 2015 | $2,144 | $18,701 | $5,114 | $13,587 |
| 2014 | $2,144 | $17,811 | $5,100 | $12,711 |
Source: Public Records
Map
Nearby Homes
- 2158 S 46th Dr
- 4334 W 24th Place
- 4429 W 25 Dr
- 2628 S 44th Trail
- 4268 W 24th Rd
- 2589 S 43rd Trail
- 2271 S 42nd Ave
- 4191 W 25th St
- 4708 W 28th Place
- 4526 Irma St
- 0060 S 48th Ave
- 1765 S 48th Ave
- 2872 S 48th Dr
- 4588 W La Quinta Ln
- 1718 S 47th Dr
- 4147 W 27th Place
- 4655 W Sun Down Dr
- 4599 W La Quinta Ln
- 4549 W 16th Ln
- 4332 W 17th Place