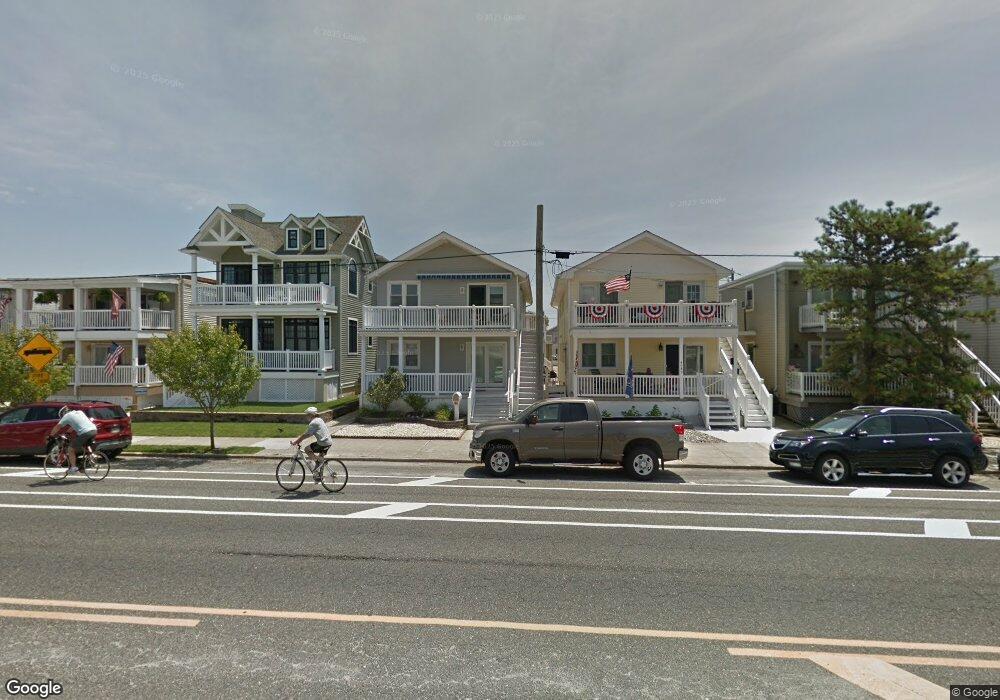
4645 West Ave Unit 47 Ocean City, NJ 08226
Estimated Value: $677,968 - $871,000
--
Bed
--
Bath
940
Sq Ft
$830/Sq Ft
Est. Value
About This Home
This home is located at 4645 West Ave Unit 47, Ocean City, NJ 08226 and is currently estimated at $779,992, approximately $829 per square foot. 4645 West Ave Unit 47 is a home located in Cape May County with nearby schools including Ocean City Primary School, Ocean City Intermediate School, and Ocean City High School.
Ownership History
Date
Name
Owned For
Owner Type
Purchase Details
Closed on
Oct 23, 2017
Sold by
Brinker Thomas M and Brinker Donna
Bought by
Davis Robert F and Davis Wendy S
Current Estimated Value
Purchase Details
Closed on
Jun 18, 2015
Sold by
Busz David and Busz Diane
Bought by
Brinker Thomas M and Brinker Donna
Purchase Details
Closed on
May 22, 2012
Sold by
Delorenzo Pasquale A and Delorenzo Helen A
Bought by
Busz Maria
Home Financials for this Owner
Home Financials are based on the most recent Mortgage that was taken out on this home.
Original Mortgage
$221,750
Interest Rate
3.9%
Mortgage Type
New Conventional
Purchase Details
Closed on
May 26, 2000
Sold by
Wood Donald M
Bought by
Delorenzo Pasquale A and Delorenzo Helen A
Home Financials for this Owner
Home Financials are based on the most recent Mortgage that was taken out on this home.
Original Mortgage
$208,000
Interest Rate
8.14%
Create a Home Valuation Report for This Property
The Home Valuation Report is an in-depth analysis detailing your home's value as well as a comparison with similar homes in the area
Home Values in the Area
Average Home Value in this Area
Purchase History
| Date | Buyer | Sale Price | Title Company |
|---|---|---|---|
| Davis Robert F | $385,500 | North American Title Agency | |
| Brinker Thomas M | $358,000 | Attorney | |
| Busz Maria | $371,750 | None Available | |
| Delorenzo Pasquale A | $260,000 | -- |
Source: Public Records
Mortgage History
| Date | Status | Borrower | Loan Amount |
|---|---|---|---|
| Previous Owner | Busz Maria | $221,750 | |
| Previous Owner | Delorenzo Pasquale A | $208,000 |
Source: Public Records
Tax History Compared to Growth
Tax History
| Year | Tax Paid | Tax Assessment Tax Assessment Total Assessment is a certain percentage of the fair market value that is determined by local assessors to be the total taxable value of land and additions on the property. | Land | Improvement |
|---|---|---|---|---|
| 2025 | $3,562 | $317,500 | $207,400 | $110,100 |
| 2024 | $3,562 | $317,500 | $207,400 | $110,100 |
| 2023 | $3,400 | $317,500 | $207,400 | $110,100 |
| 2022 | $3,267 | $317,500 | $207,400 | $110,100 |
| 2021 | $2,367 | $317,500 | $207,400 | $110,100 |
| 2020 | $3,105 | $317,500 | $207,400 | $110,100 |
| 2019 | $3,070 | $317,500 | $207,400 | $110,100 |
| 2018 | $3,042 | $317,500 | $207,400 | $110,100 |
| 2017 | $2,994 | $317,500 | $207,400 | $110,100 |
| 2016 | $2,880 | $317,500 | $207,400 | $110,100 |
| 2015 | $2,842 | $317,500 | $207,400 | $110,100 |
| 2014 | $2,800 | $317,500 | $207,400 | $110,100 |
Source: Public Records
Map
Nearby Homes
- 4641 West Ave Unit 1
- 4550 Asbury Ave
- 4818 Asbury Ave Unit 1
- 4818-20 Asbury Ave
- 4448 West Ave Unit 11
- 4923 Central Ave Unit 2
- 4919 Central Ave
- 4350 West Ave Unit 37
- 4933 Central Ave Unit 4933
- 4236 Asbury Ave Unit 1
- 4102 West Ave Unit 2
- 5225 Asbury Ave Unit 1
- 5242 West Ave Unit 2
- 5235 Central Ave
- 13 53rd St
- 5315 West Ave
- 3913 Central Ave Unit A
- 5404 Bay Ave
- 3827 Asbury Ave Unit 2
- 3815 West Ave Unit 2nd floor
- 4645 West Ave Unit 1
- 4645 West Ave Unit 1st Floor
- 4645-47 West Ave
- 4649 West Ave Unit 1
- 4649 West Ave Unit 51
- 4649 West Ave Unit 51
- 4641 West Ave
- 4637-39 West Ave Unit 39 B
- 4637 West Ave Unit 1st FL
- 4637 West Ave Unit 39
- 4637 West Ave Unit 39
- 4637 West Ave
- 4637 West Ave Unit B
- 4653 West Ave Unit 55
- 4653 West Ave Unit 55
- 4657 W Ave 1st Floor Unit 1st Floor
- 4657 West Ave Unit 59
- 4657 West Ave Unit 59
- 4633 West Ave Unit 35
- 4633 West Ave Unit 35