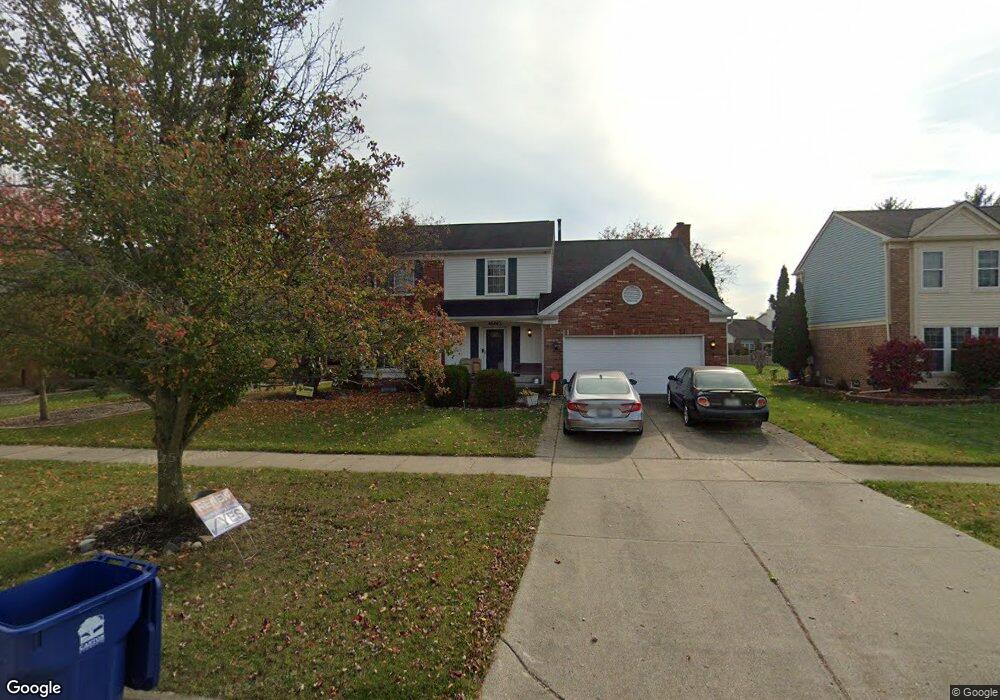
46463 Hanford Rd Canton, MI 48187
Sunflower Village NeighborhoodEstimated Value: $448,325 - $512,000
--
Bed
3
Baths
2,060
Sq Ft
$238/Sq Ft
Est. Value
About This Home
This home is located at 46463 Hanford Rd, Canton, MI 48187 and is currently estimated at $489,331, approximately $237 per square foot. 46463 Hanford Rd is a home located in Wayne County with nearby schools including Canton High School, Plymouth High School, and Salem High School.
Ownership History
Date
Name
Owned For
Owner Type
Purchase Details
Closed on
Oct 11, 2019
Sold by
Zahler Jennifer Nell and Moore Jennifer Nee
Bought by
Zahler Anthony D
Current Estimated Value
Purchase Details
Closed on
Mar 5, 2013
Sold by
Moore Gerald E and Moore Jennifer Nell
Bought by
Moore Jennifer Nell
Purchase Details
Closed on
Dec 9, 2003
Sold by
Malie David S and Malie Christine K
Bought by
Moore Gerald E
Purchase Details
Closed on
Feb 16, 2001
Sold by
Carlson Gerald W
Bought by
Malie David S
Purchase Details
Closed on
Dec 29, 1997
Sold by
Dorw James T and Dorw Roberta S
Bought by
Carlson Gerald W
Purchase Details
Closed on
Jul 5, 1994
Sold by
Czarnecki Carl G
Bought by
Czarnecki Carl
Home Financials for this Owner
Home Financials are based on the most recent Mortgage that was taken out on this home.
Original Mortgage
$148,000
Interest Rate
8.6%
Mortgage Type
New Conventional
Create a Home Valuation Report for This Property
The Home Valuation Report is an in-depth analysis detailing your home's value as well as a comparison with similar homes in the area
Home Values in the Area
Average Home Value in this Area
Purchase History
| Date | Buyer | Sale Price | Title Company |
|---|---|---|---|
| Zahler Anthony D | -- | None Available | |
| Moore Jennifer Nell | -- | None Available | |
| Moore Gerald E | $292,500 | Commonwealth Land Title | |
| Malie David S | $264,900 | -- | |
| Carlson Gerald W | $212,000 | -- | |
| Czarnecki Carl | $185,000 | -- |
Source: Public Records
Mortgage History
| Date | Status | Borrower | Loan Amount |
|---|---|---|---|
| Previous Owner | Czarnecki Carl | $148,000 |
Source: Public Records
Tax History Compared to Growth
Tax History
| Year | Tax Paid | Tax Assessment Tax Assessment Total Assessment is a certain percentage of the fair market value that is determined by local assessors to be the total taxable value of land and additions on the property. | Land | Improvement |
|---|---|---|---|---|
| 2025 | $2,191 | $202,800 | $0 | $0 |
| 2024 | $2,191 | $184,500 | $0 | $0 |
| 2023 | $2,089 | $164,700 | $0 | $0 |
| 2022 | $4,583 | $153,300 | $0 | $0 |
| 2021 | $4,448 | $146,500 | $0 | $0 |
| 2020 | $4,392 | $148,100 | $0 | $0 |
| 2019 | $4,311 | $138,140 | $0 | $0 |
| 2018 | $1,776 | $132,520 | $0 | $0 |
| 2017 | $4,406 | $130,900 | $0 | $0 |
| 2016 | $3,923 | $129,500 | $0 | $0 |
| 2015 | $9,757 | $123,720 | $0 | $0 |
| 2013 | $9,452 | $101,170 | $0 | $0 |
| 2010 | -- | $98,030 | $40,950 | $57,080 |
Source: Public Records
Map
Nearby Homes
- 6295 N Beck Rd
- 47582 Fox Ct
- 46500 E Oak Manor Ct
- 00000 Maben Rd
- 6844 Woodmere Dr
- 5872 Meadowview Dr
- 47691 Royal Pointe Dr
- 48107 Hanford Rd
- 7225 Camelia Ct
- 6596 Chadwick Dr
- 7040 Royal Villa Ct Unit 6
- 6680 Kings Mill Dr
- 6894 Kings Mill Dr
- 48590 Ford Rd
- 50782 Ross St
- 5885 Fairborn Dr
- 0000 Ford
- 1300 N Beck Rd
- 1525 Peninsula Ct Unit 150
- 1273 Kennebec
- 46527 Hanford Rd
- 46464 Larchmont Dr
- 46591 Hanford Rd
- 46400 Larchmont Dr
- 46482 Larchmont Dr
- 46464 Hanford Rd
- 46400 Hanford Rd
- 46528 Hanford Rd
- 46655 Hanford Rd
- 46335 Hanford Rd
- 46592 Hanford Rd
- 46334 Larchmont Dr
- 46719 Hanford Rd
- 46336 Hanford Rd
- 46656 Hanford Rd
- 46271 Hanford Rd
- 46401 Larchmont Dr
- 46465 Gunnery Dr
- 46290 Larchmont Dr
- 46529 Gunnery Dr