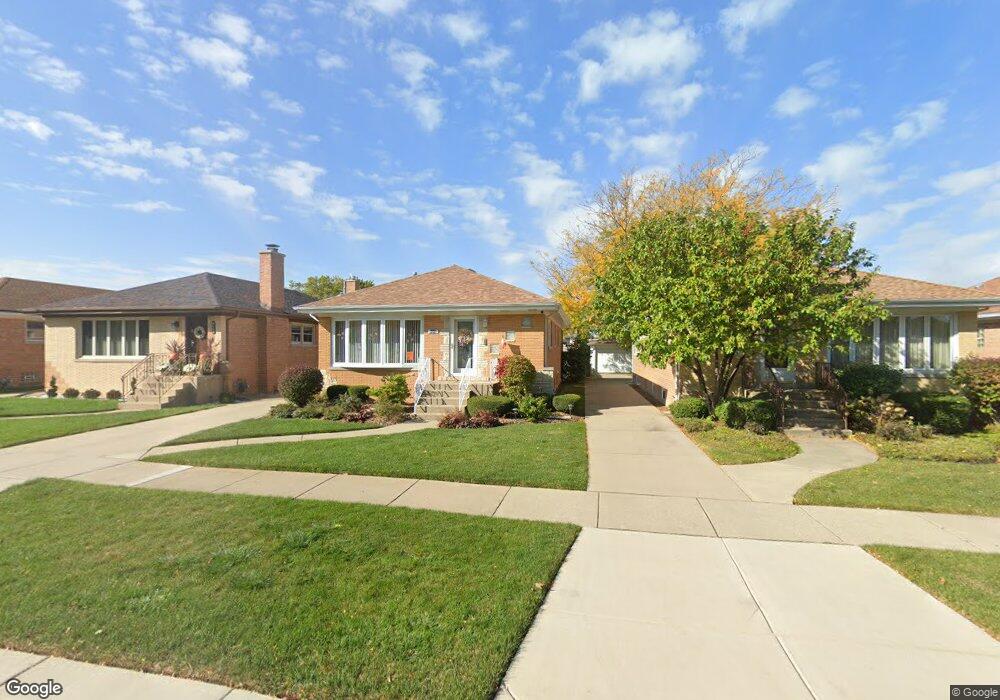
4648 N Overhill Ave Norridge, IL 60706
Estimated Value: $418,000 - $435,000
3
Beds
1
Bath
1,248
Sq Ft
$341/Sq Ft
Est. Value
About This Home
This home is located at 4648 N Overhill Ave, Norridge, IL 60706 and is currently estimated at $425,632, approximately $341 per square foot. 4648 N Overhill Ave is a home located in Cook County with nearby schools including J Giles Elementary School, Ridgewood Community High School, and St Eugene School.
Ownership History
Date
Name
Owned For
Owner Type
Purchase Details
Closed on
Jun 13, 2001
Sold by
Ciccone Domenico and Giacalone Maria Rosaria
Bought by
Giacalone Christian and Giacalone Maria Rosaria
Current Estimated Value
Home Financials for this Owner
Home Financials are based on the most recent Mortgage that was taken out on this home.
Original Mortgage
$196,000
Outstanding Balance
$74,878
Interest Rate
7.18%
Estimated Equity
$350,754
Purchase Details
Closed on
Apr 3, 2000
Sold by
Gentuso Mark
Bought by
Ciccone Domenico and Ciccone Maria Rosaria
Home Financials for this Owner
Home Financials are based on the most recent Mortgage that was taken out on this home.
Original Mortgage
$195,000
Interest Rate
7.37%
Purchase Details
Closed on
Dec 29, 1999
Sold by
Janda Edward J
Bought by
Gentuso Mark
Home Financials for this Owner
Home Financials are based on the most recent Mortgage that was taken out on this home.
Original Mortgage
$175,000
Interest Rate
7.89%
Create a Home Valuation Report for This Property
The Home Valuation Report is an in-depth analysis detailing your home's value as well as a comparison with similar homes in the area
Home Values in the Area
Average Home Value in this Area
Purchase History
| Date | Buyer | Sale Price | Title Company |
|---|---|---|---|
| Giacalone Christian | -- | -- | |
| Ciccone Domenico | $251,000 | Mercury Title Company | |
| Gentuso Mark | $220,000 | First American Title |
Source: Public Records
Mortgage History
| Date | Status | Borrower | Loan Amount |
|---|---|---|---|
| Open | Giacalone Christian | $196,000 | |
| Closed | Ciccone Domenico | $195,000 | |
| Previous Owner | Gentuso Mark | $175,000 |
Source: Public Records
Tax History Compared to Growth
Tax History
| Year | Tax Paid | Tax Assessment Tax Assessment Total Assessment is a certain percentage of the fair market value that is determined by local assessors to be the total taxable value of land and additions on the property. | Land | Improvement |
|---|---|---|---|---|
| 2024 | $7,302 | $35,000 | $6,968 | $28,032 |
| 2023 | $7,096 | $35,000 | $6,968 | $28,032 |
| 2022 | $7,096 | $35,000 | $6,968 | $28,032 |
| 2021 | $5,847 | $26,319 | $6,164 | $20,155 |
| 2020 | $5,756 | $26,319 | $6,164 | $20,155 |
| 2019 | $5,740 | $29,539 | $6,164 | $23,375 |
| 2018 | $5,674 | $25,649 | $5,092 | $20,557 |
| 2017 | $5,549 | $25,649 | $5,092 | $20,557 |
| 2016 | $5,437 | $25,649 | $5,092 | $20,557 |
| 2015 | $5,312 | $23,481 | $4,422 | $19,059 |
| 2014 | $5,246 | $23,481 | $4,422 | $19,059 |
| 2013 | $5,125 | $23,481 | $4,422 | $19,059 |
Source: Public Records
Map
Nearby Homes
- 4621 N Ozanam Ave
- 7650 W Lawrence Ave Unit 201
- 7616 W Lawrence Ave Unit 3A
- 7604 W Lawrence Ave Unit 1B
- 7641 W Ainslie St
- 4617 N Canfield Ave
- 4937 N Ozanam Ave
- 7632 W Norridge St
- 4404 N Opal Ave
- 4811 N Olcott Ave Unit 307
- 4338 N Overhill Ave
- 4436 N Osage Ave
- 7636 W Strong St
- 4833 N Olcott Ave Unit 307
- 7410 W Lawrence Ave Unit 115
- 8025 W Giddings St
- 7502 W Strong St
- 7519 W Argyle St
- 4304 N Oriole Ave
- 4236 N Ozark Ave
- 4652 N Overhill Ave
- 4644 N Overhill Ave
- 4656 N Overhill Ave
- 4640 N Overhill Ave
- 4700 N Overhill Ave
- 4636 N Overhill Ave
- 4649 N Ozark Ave
- 4653 N Ozark Ave
- 4645 N Ozark Ave
- 4657 N Ozark Ave
- 4641 N Ozark Ave
- 4704 N Overhill Ave
- 4632 N Overhill Ave
- 4701 N Ozark Ave
- 4637 N Ozark Ave
- 4708 N Overhill Ave
- 4628 N Overhill Ave
- 4705 N Ozark Ave
- 4633 N Ozark Ave
- 4709 N Ozark Ave