Estimated Value: $433,000 - $441,000
4
Beds
2
Baths
2,300
Sq Ft
$190/Sq Ft
Est. Value
About This Home
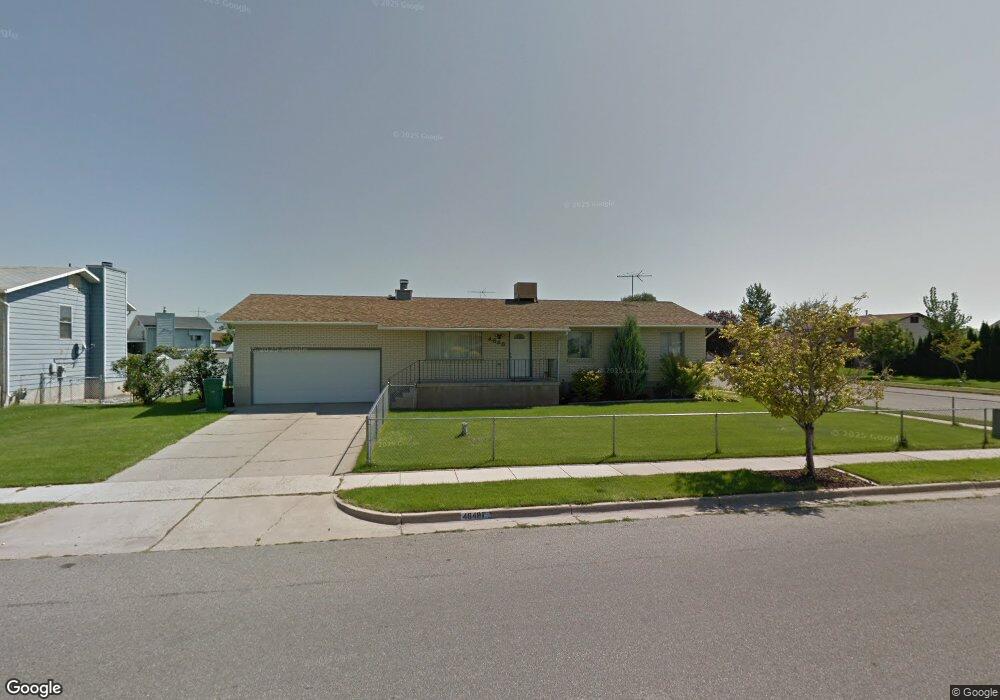
This home is located at 4648 S 3900 W, Roy, UT 84067 and is currently estimated at $436,217, approximately $189 per square foot. 4648 S 3900 W is a home located in Weber County with nearby schools including West Haven School, Sand Ridge Junior High School, and Roy High School.
Ownership History
Date
Name
Owned For
Owner Type
Purchase Details
Closed on
Mar 29, 2021
Sold by
Dyer Dayne
Bought by
Hughes Chris and Hughes Jaimielle
Current Estimated Value
Home Financials for this Owner
Home Financials are based on the most recent Mortgage that was taken out on this home.
Original Mortgage
$373
Outstanding Balance
$335
Interest Rate
3.17%
Mortgage Type
FHA
Estimated Equity
$435,882
Purchase Details
Closed on
Jul 3, 2018
Sold by
Dyer Dayne Devaud
Bought by
Dyer Dayne
Home Financials for this Owner
Home Financials are based on the most recent Mortgage that was taken out on this home.
Original Mortgage
$238,000
Interest Rate
4.6%
Mortgage Type
VA
Purchase Details
Closed on
Nov 29, 2016
Sold by
Bonnie F Powell
Bought by
Dyer Dayne
Home Financials for this Owner
Home Financials are based on the most recent Mortgage that was taken out on this home.
Original Mortgage
$189,900
Interest Rate
4.03%
Purchase Details
Closed on
Aug 11, 2015
Sold by
Powell Bonnie F
Bought by
Powell Bonnie F
Create a Home Valuation Report for This Property
The Home Valuation Report is an in-depth analysis detailing your home's value as well as a comparison with similar homes in the area
Home Values in the Area
Average Home Value in this Area
Purchase History
| Date | Buyer | Sale Price | Title Company |
|---|---|---|---|
| Hughes Chris | -- | Old Republic Title | |
| Dyer Dayne | -- | North American Title | |
| Dyer Dayne | -- | -- | |
| Powell Bonnie F | -- | None Available |
Source: Public Records
Mortgage History
| Date | Status | Borrower | Loan Amount |
|---|---|---|---|
| Open | Hughes Chris | $373 | |
| Open | Hughes Chris | $19,000 | |
| Previous Owner | Dyer Dayne | $238,000 | |
| Previous Owner | Dyer Dayne | $189,900 | |
| Previous Owner | Dyer Dayne | -- |
Source: Public Records
Tax History
| Year | Tax Paid | Tax Assessment Tax Assessment Total Assessment is a certain percentage of the fair market value that is determined by local assessors to be the total taxable value of land and additions on the property. | Land | Improvement |
|---|---|---|---|---|
| 2025 | $2,625 | $416,211 | $120,544 | $295,667 |
| 2024 | $2,561 | $224,949 | $66,299 | $158,650 |
| 2023 | $2,509 | $221,100 | $55,078 | $166,022 |
| 2022 | $2,556 | $232,100 | $53,525 | $178,575 |
| 2021 | $1,986 | $294,000 | $69,085 | $224,915 |
| 2020 | $190 | $245,000 | $69,085 | $175,915 |
| 2019 | $190 | $235,000 | $42,361 | $192,639 |
| 2018 | $1,870 | $227,000 | $38,236 | $188,764 |
| 2017 | $1,690 | $191,000 | $38,236 | $152,764 |
| 2016 | $1,633 | $99,223 | $20,195 | $79,028 |
| 2015 | $1,413 | $87,516 | $20,195 | $67,321 |
| 2014 | $1,290 | $77,925 | $20,195 | $57,730 |
Source: Public Records
Map
Nearby Homes
- 4602 S 4000 W
- 4024 W 4650 S
- 4813 S 3850 W
- 4950 3900 West St
- 4101 W 4600 S
- 3808 W 4300 S
- 3610 W 4475 S
- 3517 W 4835 S Unit 27
- 4486 S 4300 W
- 3509 W 4835 S Unit 26
- 4853 S 4275 W Unit 27
- 4088 W 5050 S
- 3405 W 4525 S
- 4218 W 5050 S
- 4096 W 5075 S
- 4491 Haven Creek Rd Unit A
- 5035 S 4275 W
- 4510 Stone Creek Rd Unit F
- 3511 W 4200 S
- 4322 S 3450 W
Your Personal Tour Guide
Ask me questions while you tour the home.