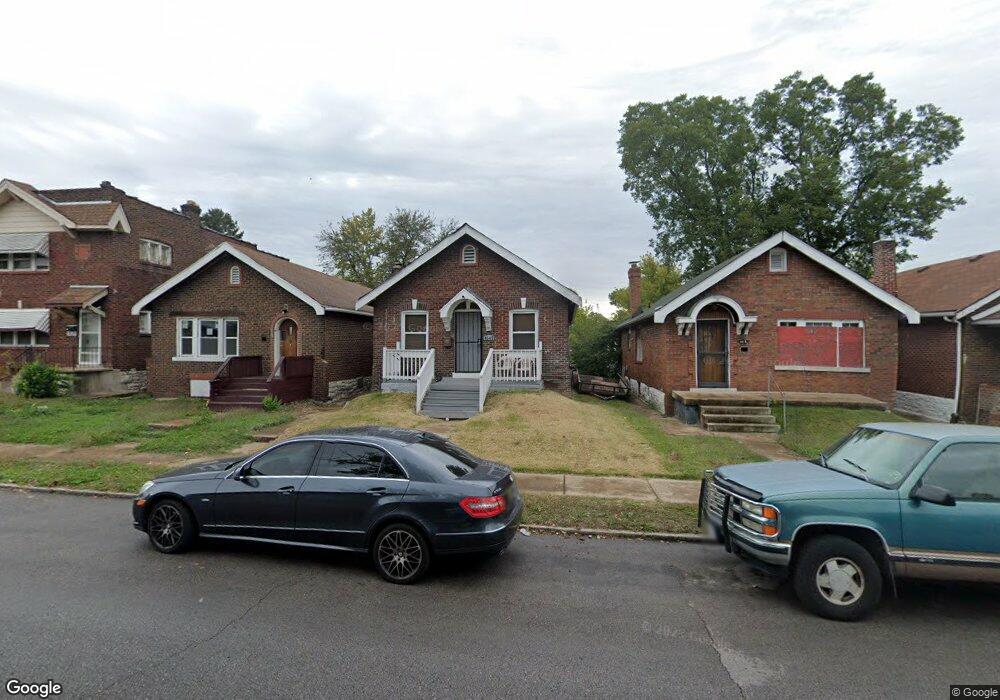
4649 Lee Ave Saint Louis, MO 63115
Penrose NeighborhoodEstimated Value: $55,022 - $87,000
2
Beds
1
Bath
893
Sq Ft
$83/Sq Ft
Est. Value
About This Home
This home is located at 4649 Lee Ave, Saint Louis, MO 63115 and is currently estimated at $74,256, approximately $83 per square foot. 4649 Lee Ave is a home located in St. Louis City with nearby schools including Ashland Elementary School, Yeatman-Liddell Middle School, and Vashon High School.
Ownership History
Date
Name
Owned For
Owner Type
Purchase Details
Closed on
Oct 23, 2024
Sold by
Woodard Daniel and Rice Tameka
Bought by
Woodard Daniel
Current Estimated Value
Purchase Details
Closed on
Nov 4, 2022
Sold by
Rice Tameka
Bought by
Woodard Daniel and Rice Tameka
Purchase Details
Closed on
Jul 1, 2021
Sold by
Land Reutilization Authority Of City Of
Bought by
Rice Tameka L
Purchase Details
Closed on
Jan 9, 2015
Sold by
City Of St Louis
Bought by
The Land Reutilization Authority Of The
Purchase Details
Closed on
Nov 15, 2009
Sold by
Ens Reo Group Llc
Bought by
Bem Viver Llc
Purchase Details
Closed on
Sep 3, 2009
Sold by
Deutsche Bank Trust Company Americas
Bought by
Ens Reo Group Llc
Purchase Details
Closed on
Jun 9, 2009
Sold by
Simpson John and Simpson Edna L
Bought by
Deutsche Bank Trust Company Americas and Bankers Trust Company
Create a Home Valuation Report for This Property
The Home Valuation Report is an in-depth analysis detailing your home's value as well as a comparison with similar homes in the area
Home Values in the Area
Average Home Value in this Area
Purchase History
| Date | Buyer | Sale Price | Title Company |
|---|---|---|---|
| Woodard Daniel | -- | None Listed On Document | |
| Woodard Daniel | -- | -- | |
| Rice Tameka L | $1,000 | None Available | |
| The Land Reutilization Authority Of The | -- | None Available | |
| Bem Viver Llc | $3,950 | None Available | |
| Ens Reo Group Llc | -- | None Available | |
| Deutsche Bank Trust Company Americas | $4,250 | None Available |
Source: Public Records
Tax History Compared to Growth
Tax History
| Year | Tax Paid | Tax Assessment Tax Assessment Total Assessment is a certain percentage of the fair market value that is determined by local assessors to be the total taxable value of land and additions on the property. | Land | Improvement |
|---|---|---|---|---|
| 2025 | $210 | $2,250 | $460 | $1,790 |
| 2024 | $202 | $2,180 | $460 | $1,720 |
| 2023 | $202 | $2,180 | $460 | $1,720 |
| 2022 | $206 | $2,150 | $460 | $1,690 |
| 2021 | $0 | $2,150 | $460 | $1,690 |
| 2020 | $0 | $2,150 | $460 | $1,690 |
| 2019 | $0 | $2,150 | $460 | $1,690 |
| 2018 | $0 | $2,130 | $460 | $1,670 |
| 2017 | $0 | $2,130 | $460 | $1,670 |
| 2016 | $391 | $2,720 | $860 | $1,860 |
| 2015 | $391 | $2,720 | $860 | $1,860 |
| 2014 | $391 | $2,720 | $860 | $1,860 |
| 2013 | -- | $4,790 | $860 | $3,930 |
Source: Public Records
Map
Nearby Homes
- 4655 Lee Ave
- 4607 Lee Ave
- 4681 Kossuth Ave
- 4629 Farlin Ave
- 4707 Farlin Ave
- 4499 Lee Ave Unit B
- 4556 Carter Ave
- 4246 N Taylor Ave
- 4843 Lee Ave
- 4534 Margaretta Ave
- 4477 Bessie Ave
- 3003 TAYOR N Taylor Ave
- 4341 Shreve Ave
- 4430 Sexauer Ave
- 4823 San Francisco Ave
- 4627 Korte Ave
- 4449 Anderson Ave
- 4538 San Francisco Ave
- 4848 Calvin Ave
- 4418 Dryden Ave