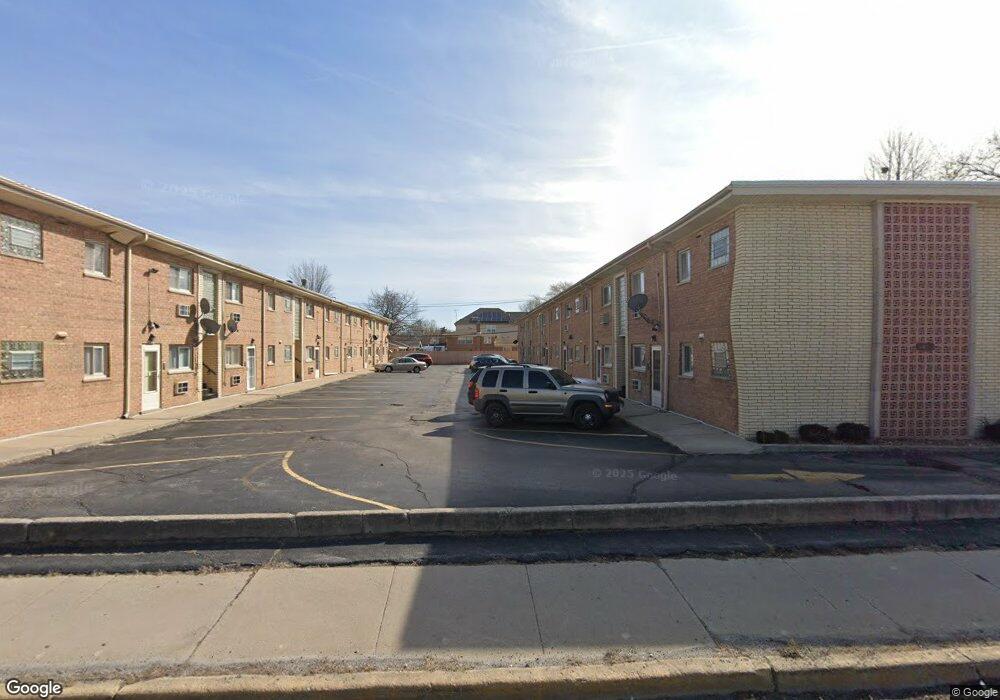
4649 W 95th St Unit 4649B Oak Lawn, IL 60453
Estimated Value: $130,000 - $171,879
3
Beds
1
Bath
1,323
Sq Ft
$113/Sq Ft
Est. Value
About This Home
This home is located at 4649 W 95th St Unit 4649B, Oak Lawn, IL 60453 and is currently estimated at $149,220, approximately $112 per square foot. 4649 W 95th St Unit 4649B is a home located in Cook County with nearby schools including Sward Elementary School, J Covington Elementary School, and Hometown Elementary School.
Ownership History
Date
Name
Owned For
Owner Type
Purchase Details
Closed on
Jun 1, 2018
Sold by
Dodda Siva and Dodda Geetha
Bought by
Vidal Luis and Ruiz Vidal Perpetua
Current Estimated Value
Purchase Details
Closed on
Jun 4, 2010
Sold by
Federal Home Loan Mortgage Corporation
Bought by
Dodda Geetha and Dodda Siva
Purchase Details
Closed on
Feb 5, 2010
Sold by
Turner Beatrice
Bought by
Federal Home Loan Mortgage Corp
Purchase Details
Closed on
Sep 24, 2007
Sold by
Wysocki John
Bought by
Jaxter Investment Inc
Purchase Details
Closed on
Sep 25, 2006
Sold by
Tresch Michael K
Bought by
Turner Beatrice
Home Financials for this Owner
Home Financials are based on the most recent Mortgage that was taken out on this home.
Original Mortgage
$115,920
Interest Rate
7.15%
Mortgage Type
Unknown
Create a Home Valuation Report for This Property
The Home Valuation Report is an in-depth analysis detailing your home's value as well as a comparison with similar homes in the area
Home Values in the Area
Average Home Value in this Area
Purchase History
| Date | Buyer | Sale Price | Title Company |
|---|---|---|---|
| Vidal Luis | $81,000 | Fidelity National Title | |
| Dodda Geetha | $64,000 | Atgf Inc | |
| Federal Home Loan Mortgage Corp | -- | None Available | |
| Jaxter Investment Inc | -- | None Available | |
| Turner Beatrice | $145,000 | Cti |
Source: Public Records
Mortgage History
| Date | Status | Borrower | Loan Amount |
|---|---|---|---|
| Previous Owner | Turner Beatrice | $115,920 |
Source: Public Records
Tax History Compared to Growth
Tax History
| Year | Tax Paid | Tax Assessment Tax Assessment Total Assessment is a certain percentage of the fair market value that is determined by local assessors to be the total taxable value of land and additions on the property. | Land | Improvement |
|---|---|---|---|---|
| 2024 | $3,926 | $12,835 | $1,403 | $11,432 |
| 2023 | $2,668 | $12,835 | $1,403 | $11,432 |
| 2022 | $2,668 | $7,044 | $1,497 | $5,547 |
| 2021 | $2,609 | $7,043 | $1,496 | $5,547 |
| 2020 | $2,557 | $7,043 | $1,496 | $5,547 |
| 2019 | $2,487 | $6,857 | $1,356 | $5,501 |
| 2018 | $2,392 | $6,857 | $1,356 | $5,501 |
| 2017 | $2,396 | $6,857 | $1,356 | $5,501 |
| 2016 | $1,553 | $4,239 | $1,122 | $3,117 |
| 2015 | $1,536 | $4,239 | $1,122 | $3,117 |
| 2014 | $1,519 | $4,239 | $1,122 | $3,117 |
| 2013 | $1,894 | $5,886 | $1,122 | $4,764 |
Source: Public Records
Map
Nearby Homes
- 9520 S Kenton Ave
- 9510 S Kolmar Ave Unit 406
- 9510 S Kolmar Ave Unit 311
- 9526 S Kilbourn Ave
- 4560 W 93rd St Unit 2D
- 4530 W 93rd St Unit 2B
- 9523 S Kostner Ave
- 9617 Brandt Ave
- 9821 S Cicero Ave Unit 8
- 9516 S Kildare Ave Unit 2N
- 9246 S 49th Ave
- 9330 S 50th Ave
- 9212 S 49th Ct
- 4211 W 95th St Unit 1C
- 4930 W 92nd St
- 9904 S Cicero Ave
- 4501 W 90th Place
- 9001 S Cicero Ave Unit 6
- 9001 S Cicero Ave Unit 116
- 5100 W 96th St Unit 204
- 4649 W 95th St Unit A
- 4649 W 95th St Unit B
- 4649 W 95th St Unit 4649A
- 4649 W 95th St Unit 2B
- 4651 W 95th St Unit 4651
- 4647 W 95th St Unit 4647
- 4643 W 95th St Unit 4643
- 4633 W 95th St Unit 4633
- 4633 W 95th St Unit 1
- 4655 W 95th St Unit 4655
- 4639 W 95th St Unit 4639N
- 4639 W 95th St Unit 4639S
- 4639 W 95th St Unit 4637
- 4637 W 95th St Unit 4637
- 4637 W 95th St Unit 1
- 4641 W 95th St Unit 4641
- 4641 W 95th St Unit 1
- 4629 W 95th St Unit 4629
- 4629 W 95th St Unit A
- 4629 W 95th St Unit A