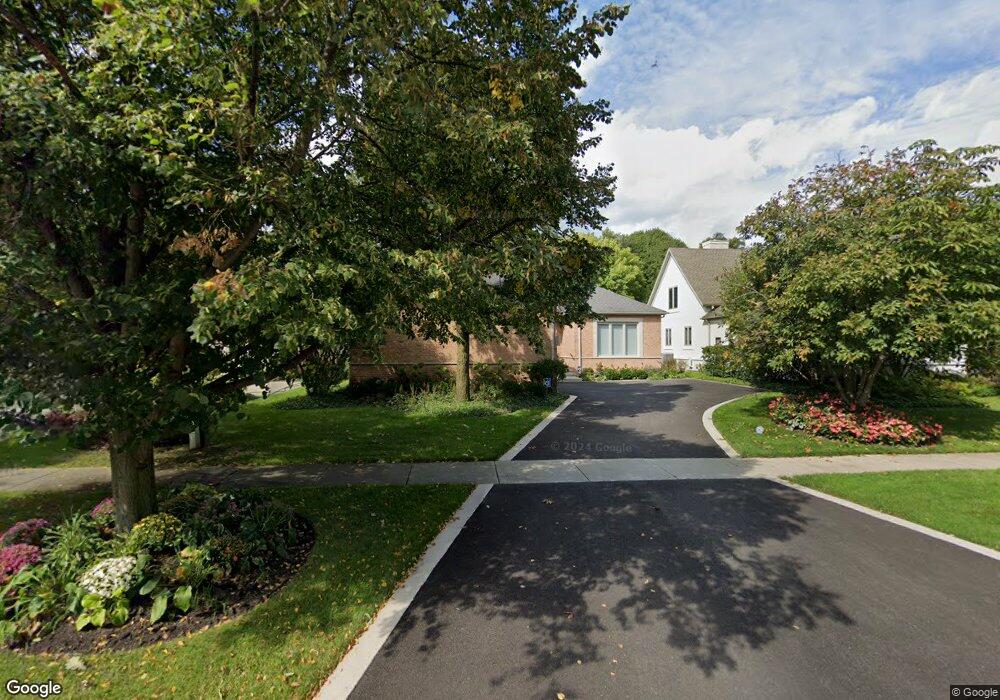
465 Beech St Highland Park, IL 60035
East Highland Park NeighborhoodEstimated Value: $1,555,000 - $1,712,000
3
Beds
3
Baths
3,016
Sq Ft
$538/Sq Ft
Est. Value
About This Home
This home is located at 465 Beech St, Highland Park, IL 60035 and is currently estimated at $1,623,612, approximately $538 per square foot. 465 Beech St is a home located in Lake County with nearby schools including Ravinia Elementary School, Edgewood Middle School, and Highland Park High School.
Ownership History
Date
Name
Owned For
Owner Type
Purchase Details
Closed on
Jul 26, 2024
Sold by
Susan W Schreiber Revocable Trust and Schreiber Susan Wyle
Bought by
Sherman Gerald J and Sherman Geri L
Current Estimated Value
Purchase Details
Closed on
Oct 2, 2019
Sold by
Schreiber Susan Wyle and Mandel Jeffrey
Bought by
Schreiber Susan W and Susan W Schreiber Revocable Trust
Purchase Details
Closed on
Sep 28, 2017
Sold by
Schreiber Sue Ellen and Wyle Patricia F
Bought by
Schreiber Susan Wyle and Mandel Jeffrey
Purchase Details
Closed on
Apr 24, 2012
Sold by
Schreiber Susan
Bought by
Schreiber Susan and John M Wyle Illinois Qtip Marital Trust
Purchase Details
Closed on
Oct 19, 2009
Sold by
Wyle Patricia F
Bought by
Wyle Patricia F and John M Wyle Revocable Trust
Purchase Details
Closed on
Jan 23, 1997
Sold by
Wyle Patricia F
Bought by
Wyle Patricia F and Patricia F Wyle Revocable Trust
Purchase Details
Closed on
Sep 30, 1994
Sold by
Centrum Realty Services Inc
Bought by
Wyle Patricia
Create a Home Valuation Report for This Property
The Home Valuation Report is an in-depth analysis detailing your home's value as well as a comparison with similar homes in the area
Home Values in the Area
Average Home Value in this Area
Purchase History
| Date | Buyer | Sale Price | Title Company |
|---|---|---|---|
| Sherman Gerald J | $1,550,000 | None Listed On Document | |
| Schreiber Susan W | -- | Attorney | |
| Schreiber Susan Wyle | -- | Attorney | |
| Schreiber Susan | -- | None Available | |
| Wyle Patricia F | -- | None Available | |
| Wyle Patricia F | -- | -- | |
| Wyle Patricia | $250,000 | Chicago Title Insurance Co |
Source: Public Records
Tax History Compared to Growth
Tax History
| Year | Tax Paid | Tax Assessment Tax Assessment Total Assessment is a certain percentage of the fair market value that is determined by local assessors to be the total taxable value of land and additions on the property. | Land | Improvement |
|---|---|---|---|---|
| 2024 | $25,044 | $325,596 | $98,363 | $227,233 |
| 2023 | $20,065 | $293,488 | $88,663 | $204,825 |
| 2022 | $20,065 | $228,818 | $97,400 | $131,418 |
| 2021 | $18,496 | $221,187 | $94,152 | $127,035 |
| 2020 | $17,897 | $221,187 | $94,152 | $127,035 |
| 2019 | $16,896 | $220,153 | $93,712 | $126,441 |
| 2018 | $19,809 | $271,019 | $102,606 | $168,413 |
| 2017 | $19,499 | $269,456 | $102,014 | $167,442 |
| 2016 | $18,782 | $256,527 | $97,119 | $159,408 |
| 2015 | $18,176 | $238,341 | $90,234 | $148,107 |
| 2014 | $17,589 | $225,758 | $80,345 | $145,413 |
| 2012 | $17,197 | $227,075 | $80,814 | $146,261 |
Source: Public Records
Map
Nearby Homes
- 906 Pleasant Ave
- 260 Beech St
- 860 Green Bay Rd
- 1330 Sheridan Rd
- 1144 Green Bay Rd
- 566 Bellevue Place
- 1610 Linden Ave
- 600 Broadview Ave
- 140 Hazel Ave
- 1601 Oakwood Ave Unit 406
- 650 Walnut St Unit 301
- 732 Bronson Ln
- 493 Hazel Ave
- 55 Prospect Ave
- 855 Sheridan Rd
- 1688 Green Bay Rd Unit 404
- 1789 Green Bay Rd Unit B
- 378 Oakland Dr
- 625 Sheridan Rd
- 861 Laurel Ave Unit 3