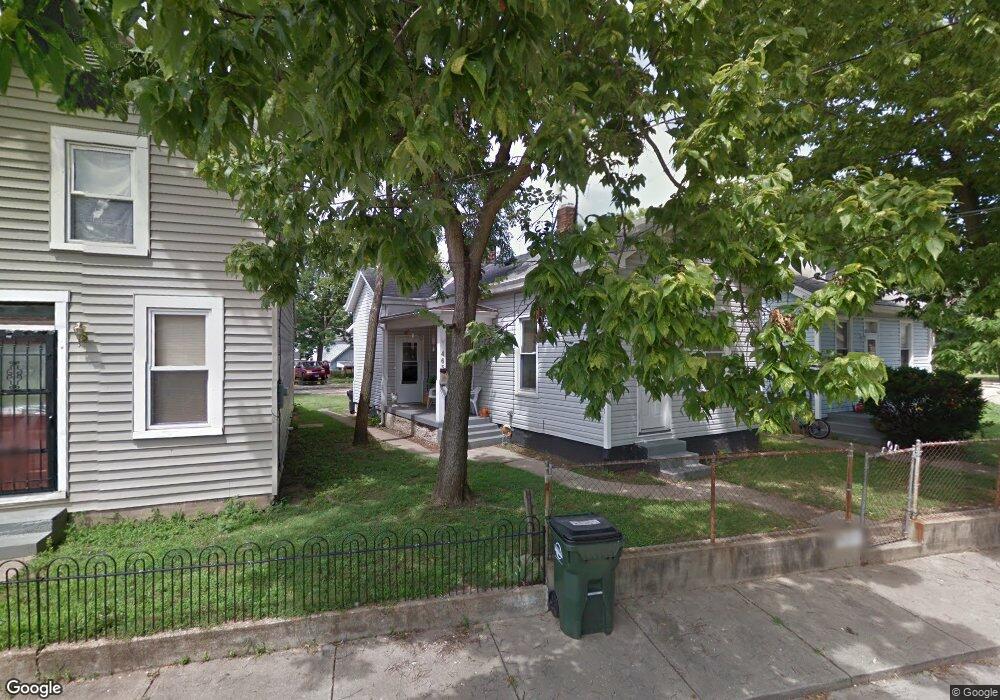
465 Bingham St Hamilton, OH 45011
East Hamilton NeighborhoodEstimated Value: $64,000 - $144,000
2
Beds
1
Bath
749
Sq Ft
$126/Sq Ft
Est. Value
About This Home
This home is located at 465 Bingham St, Hamilton, OH 45011 and is currently estimated at $94,413, approximately $126 per square foot. 465 Bingham St is a home located in Butler County with nearby schools including Fairwood Elementary School, Garfield Middle School, and Hamilton Freshman School.
Ownership History
Date
Name
Owned For
Owner Type
Purchase Details
Closed on
Mar 3, 2010
Sold by
States Resources Corp
Bought by
Stepp Steven R
Current Estimated Value
Purchase Details
Closed on
Jul 14, 2003
Sold by
Ramar Llc
Bought by
Parsley Gregory A and Parsley Karen M
Home Financials for this Owner
Home Financials are based on the most recent Mortgage that was taken out on this home.
Original Mortgage
$647,000
Interest Rate
5.71%
Mortgage Type
Unknown
Purchase Details
Closed on
May 1, 1986
Create a Home Valuation Report for This Property
The Home Valuation Report is an in-depth analysis detailing your home's value as well as a comparison with similar homes in the area
Home Values in the Area
Average Home Value in this Area
Purchase History
| Date | Buyer | Sale Price | Title Company |
|---|---|---|---|
| Stepp Steven R | $10,625 | None Available | |
| Parsley Gregory A | $32,500 | -- | |
| -- | $16,100 | -- |
Source: Public Records
Mortgage History
| Date | Status | Borrower | Loan Amount |
|---|---|---|---|
| Previous Owner | Parsley Gregory A | $647,000 |
Source: Public Records
Tax History
| Year | Tax Paid | Tax Assessment Tax Assessment Total Assessment is a certain percentage of the fair market value that is determined by local assessors to be the total taxable value of land and additions on the property. | Land | Improvement |
|---|---|---|---|---|
| 2025 | $835 | $17,850 | $2,500 | $15,350 |
| 2024 | $835 | $17,850 | $2,500 | $15,350 |
| 2023 | $811 | $17,850 | $2,500 | $15,350 |
| 2022 | $1,164 | $14,460 | $2,500 | $11,960 |
| 2021 | $690 | $13,960 | $2,500 | $11,460 |
| 2020 | $717 | $13,960 | $2,500 | $11,460 |
| 2019 | $867 | $11,840 | $2,860 | $8,980 |
| 2018 | $607 | $11,840 | $2,860 | $8,980 |
| 2017 | $571 | $11,840 | $2,860 | $8,980 |
| 2016 | $636 | $11,760 | $2,860 | $8,900 |
| 2015 | $592 | $11,760 | $2,860 | $8,900 |
| 2014 | $636 | $11,760 | $2,860 | $8,900 |
| 2013 | $636 | $12,580 | $2,860 | $9,720 |
Source: Public Records
Map
Nearby Homes
Your Personal Tour Guide
Ask me questions while you tour the home.