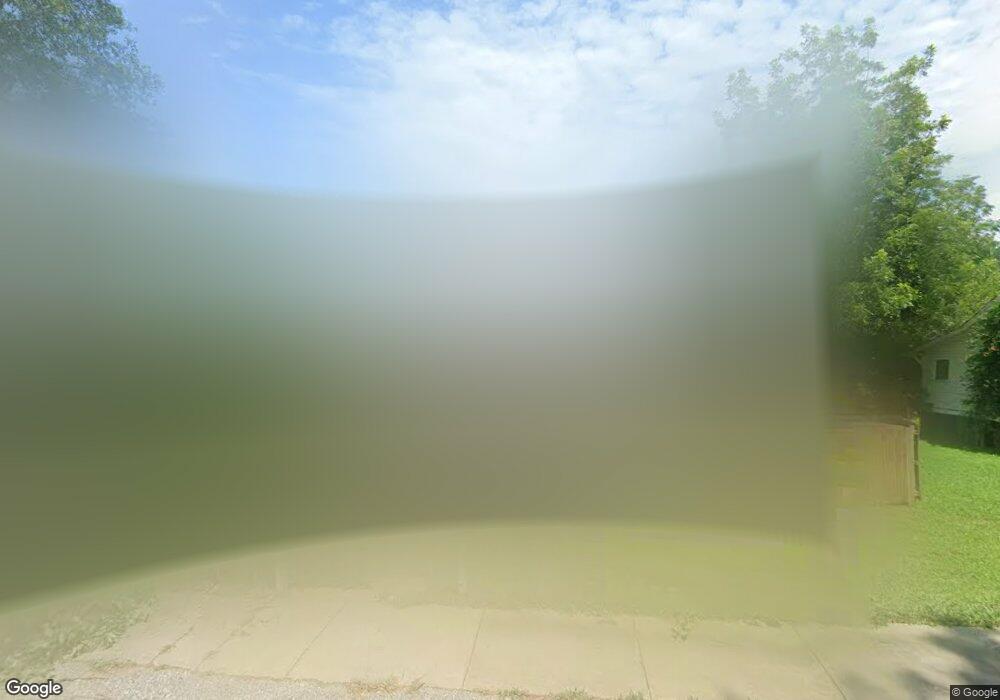
465 Buncombe St Woodruff, SC 29388
Estimated Value: $91,368 - $150,000
2
Beds
1
Bath
1,058
Sq Ft
$113/Sq Ft
Est. Value
About This Home
This home is located at 465 Buncombe St, Woodruff, SC 29388 and is currently estimated at $119,592, approximately $113 per square foot. 465 Buncombe St is a home located in Spartanburg County with nearby schools including Woodruff Primary School, Woodruff Elementary School, and Woodruff Middle School.
Ownership History
Date
Name
Owned For
Owner Type
Purchase Details
Closed on
Apr 27, 2023
Sold by
Kennedy Patrick Joseph
Bought by
Ballard Greg
Current Estimated Value
Purchase Details
Closed on
Mar 9, 2018
Sold by
Kennedy Patrick Joseph
Bought by
Ballard Greg
Purchase Details
Closed on
Feb 14, 2017
Sold by
Kennedy Patrick Joseph and Kennedy Patricia Joseph
Bought by
Heine Charles R and Heine Lena P
Purchase Details
Closed on
Sep 23, 2010
Sold by
Kennedy Patrick Joseph and Kennedy Patricia Joseph
Bought by
Heine Charles R and Heine Lena P
Purchase Details
Closed on
Nov 30, 2009
Sold by
Wolney Angela Rose and Kennedy Patrick Joseph
Bought by
Kennedy Patrick Joseph
Purchase Details
Closed on
Mar 28, 2008
Sold by
Riddle Charles E
Bought by
Kennedy Patrick Joseph and Wolney Angela Rose
Purchase Details
Closed on
May 4, 2005
Sold by
Sweatt Tom
Bought by
Riddle Charles E
Create a Home Valuation Report for This Property
The Home Valuation Report is an in-depth analysis detailing your home's value as well as a comparison with similar homes in the area
Home Values in the Area
Average Home Value in this Area
Purchase History
| Date | Buyer | Sale Price | Title Company |
|---|---|---|---|
| Ballard Greg | $16,000 | None Listed On Document | |
| Ballard Greg | -- | None Available | |
| Heine Charles R | -- | None Available | |
| Heine Charles R | $21,900 | -- | |
| Kennedy Patrick Joseph | -- | -- | |
| Kennedy Patrick Joseph | $11,000 | Attorney | |
| Riddle Charles E | $4,000 | -- |
Source: Public Records
Mortgage History
| Date | Status | Borrower | Loan Amount |
|---|---|---|---|
| Closed | Heine Charles R | $0 |
Source: Public Records
Tax History Compared to Growth
Tax History
| Year | Tax Paid | Tax Assessment Tax Assessment Total Assessment is a certain percentage of the fair market value that is determined by local assessors to be the total taxable value of land and additions on the property. | Land | Improvement |
|---|---|---|---|---|
| 2025 | $805 | $1,602 | $780 | $822 |
| 2024 | $805 | $1,602 | $780 | $822 |
| 2023 | $805 | $1,235 | $601 | $634 |
| 2022 | $548 | $1,074 | $360 | $714 |
| 2021 | $550 | $1,074 | $360 | $714 |
| 2020 | $529 | $1,074 | $360 | $714 |
| 2019 | $529 | $1,074 | $360 | $714 |
| 2018 | $525 | $1,074 | $360 | $714 |
| 2017 | $594 | $1,214 | $334 | $880 |
| 2016 | $588 | $1,214 | $334 | $880 |
| 2015 | $227 | $810 | $223 | $587 |
| 2014 | $215 | $810 | $223 | $587 |
Source: Public Records
Map
Nearby Homes