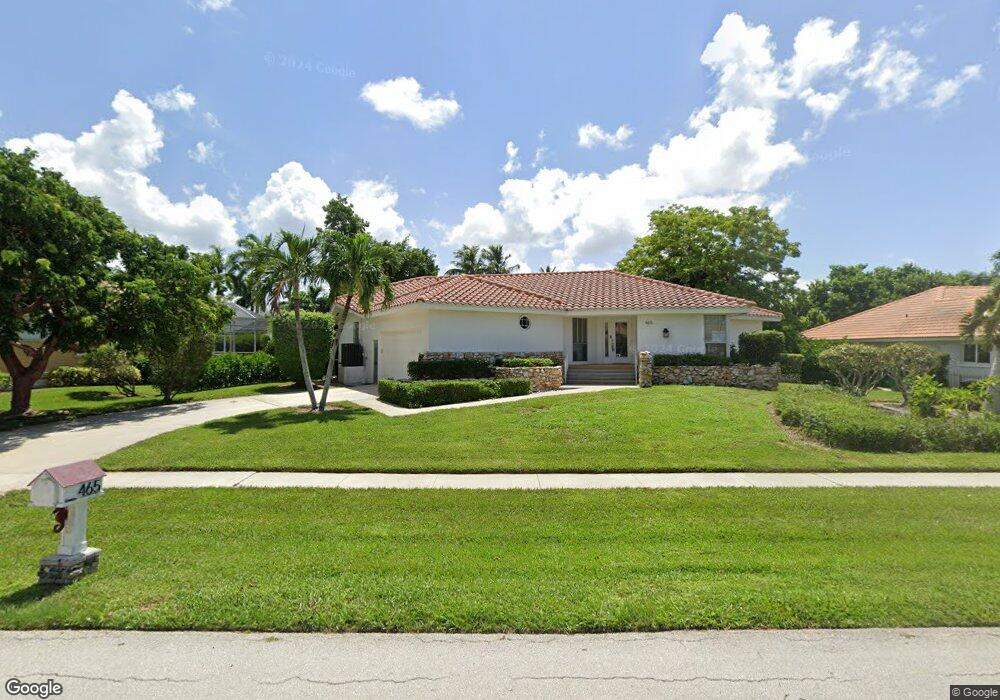
465 Century Dr Marco Island, FL 34145
Estimated Value: $1,002,000 - $1,163,000
3
Beds
3
Baths
1,972
Sq Ft
$551/Sq Ft
Est. Value
About This Home
This home is located at 465 Century Dr, Marco Island, FL 34145 and is currently estimated at $1,087,000, approximately $551 per square foot. 465 Century Dr is a home located in Collier County with nearby schools including Tommie Barfield Elementary School, Manatee Middle School, and Lely High School.
Ownership History
Date
Name
Owned For
Owner Type
Purchase Details
Closed on
Aug 20, 2010
Sold by
Leeney Robert and Leeney Niamh
Bought by
Woell Andrew S and Woell Heidi M
Current Estimated Value
Purchase Details
Closed on
Feb 3, 2004
Sold by
Brown Timothy D and Brown Mary Ann
Bought by
Leeney Robert and Leeney Niamh
Home Financials for this Owner
Home Financials are based on the most recent Mortgage that was taken out on this home.
Original Mortgage
$270,000
Interest Rate
5.63%
Purchase Details
Closed on
Jun 17, 2002
Sold by
Dobosh Robert A
Bought by
Brown Timothy D and Brown Mary Ann
Home Financials for this Owner
Home Financials are based on the most recent Mortgage that was taken out on this home.
Original Mortgage
$155,400
Interest Rate
6.86%
Create a Home Valuation Report for This Property
The Home Valuation Report is an in-depth analysis detailing your home's value as well as a comparison with similar homes in the area
Home Values in the Area
Average Home Value in this Area
Purchase History
| Date | Buyer | Sale Price | Title Company |
|---|---|---|---|
| Woell Andrew S | $357,690 | Attorney | |
| Leeney Robert | $380,000 | -- | |
| Brown Timothy D | $222,000 | -- |
Source: Public Records
Mortgage History
| Date | Status | Borrower | Loan Amount |
|---|---|---|---|
| Previous Owner | Leeney Robert | $270,000 | |
| Previous Owner | Brown Timothy D | $155,400 |
Source: Public Records
Tax History Compared to Growth
Tax History
| Year | Tax Paid | Tax Assessment Tax Assessment Total Assessment is a certain percentage of the fair market value that is determined by local assessors to be the total taxable value of land and additions on the property. | Land | Improvement |
|---|---|---|---|---|
| 2025 | $6,319 | $568,618 | -- | -- |
| 2024 | $5,944 | $516,925 | -- | -- |
| 2023 | $5,944 | $469,932 | $0 | $0 |
| 2022 | $6,102 | $427,211 | $0 | $0 |
| 2021 | $4,525 | $388,374 | $0 | $0 |
| 2020 | $4,022 | $353,067 | $160,118 | $192,949 |
| 2019 | $4,063 | $350,678 | $160,118 | $190,560 |
| 2018 | $4,393 | $361,217 | $0 | $0 |
| 2017 | $4,122 | $328,379 | $0 | $0 |
| 2016 | $3,874 | $298,526 | $0 | $0 |
| 2015 | $3,752 | $271,387 | $0 | $0 |
| 2014 | $3,158 | $246,715 | $0 | $0 |
Source: Public Records
Map
Nearby Homes