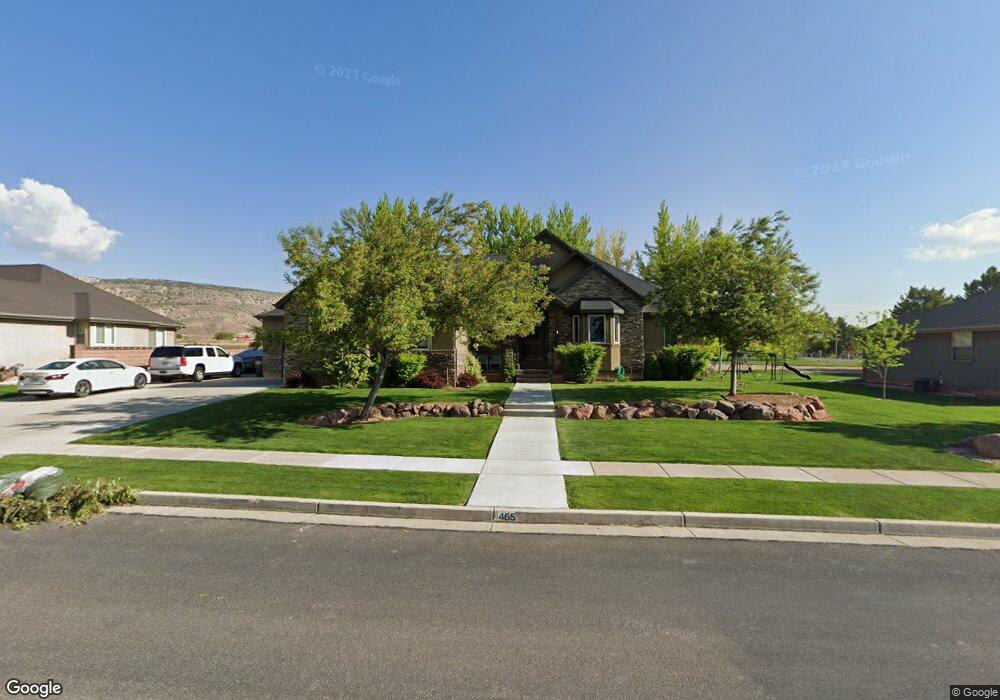
465 E 1010 N Richfield, UT 84701
Estimated Value: $656,000 - $790,000
Studio
1
Bath
3,051
Sq Ft
$236/Sq Ft
Est. Value
About This Home
This home is located at 465 E 1010 N, Richfield, UT 84701 and is currently estimated at $720,486, approximately $236 per square foot. 465 E 1010 N is a home located in Sevier County with nearby schools including Pahvant School, Ashman School, and Red Hills Middle School.
Ownership History
Date
Name
Owned For
Owner Type
Purchase Details
Closed on
Oct 16, 2017
Sold by
Bogh Tommy Lee and Bogh Emily
Bought by
Jolley Ryan W and Jolley Jennifer
Current Estimated Value
Home Financials for this Owner
Home Financials are based on the most recent Mortgage that was taken out on this home.
Original Mortgage
$326,400
Outstanding Balance
$270,359
Interest Rate
3.78%
Mortgage Type
New Conventional
Estimated Equity
$450,127
Purchase Details
Closed on
Jul 7, 2008
Sold by
Ogden Garth and Ogden Merri
Bought by
Bogh Tommy Lee and Bogh Emily
Home Financials for this Owner
Home Financials are based on the most recent Mortgage that was taken out on this home.
Original Mortgage
$150,000
Interest Rate
6.04%
Mortgage Type
Construction
Purchase Details
Closed on
Apr 13, 2007
Sold by
Kim Family Pa
Bought by
Ogden Garth and Ogden Merri
Create a Home Valuation Report for This Property
The Home Valuation Report is an in-depth analysis detailing your home's value as well as a comparison with similar homes in the area
Purchase History
| Date | Buyer | Sale Price | Title Company |
|---|---|---|---|
| Jolley Ryan W | -- | First American Title | |
| Bogh Tommy Lee | -- | First Ameican Title Insuranc | |
| Ogden Garth | -- | Utah Title & Abstract Co |
Source: Public Records
Mortgage History
| Date | Status | Borrower | Loan Amount |
|---|---|---|---|
| Open | Jolley Ryan W | $326,400 | |
| Previous Owner | Bogh Tommy Lee | $150,000 |
Source: Public Records
Tax History
| Year | Tax Paid | Tax Assessment Tax Assessment Total Assessment is a certain percentage of the fair market value that is determined by local assessors to be the total taxable value of land and additions on the property. | Land | Improvement |
|---|---|---|---|---|
| 2025 | $3,661 | $377,052 | $46,692 | $330,360 |
| 2024 | $3,661 | $400,135 | $39,508 | $360,627 |
| 2023 | $3,959 | $440,052 | $37,849 | $402,203 |
| 2022 | $3,914 | $357,373 | $39,169 | $318,204 |
| 2021 | $3,658 | $281,136 | $32,150 | $248,986 |
| 2020 | $3,418 | $255,355 | $42,900 | $212,455 |
| 2019 | $3,044 | $240,790 | $35,750 | $205,040 |
| 2018 | $3,398 | $240,790 | $35,750 | $205,040 |
| 2017 | $3,341 | $225,980 | $35,750 | $190,230 |
| 2016 | $2,472 | $225,980 | $0 | $0 |
| 2015 | $2,472 | $224,550 | $0 | $0 |
| 2014 | $2,472 | $213,860 | $0 | $0 |
Source: Public Records
Map
Nearby Homes
Your Personal Tour Guide
Ask me questions while you tour the home.