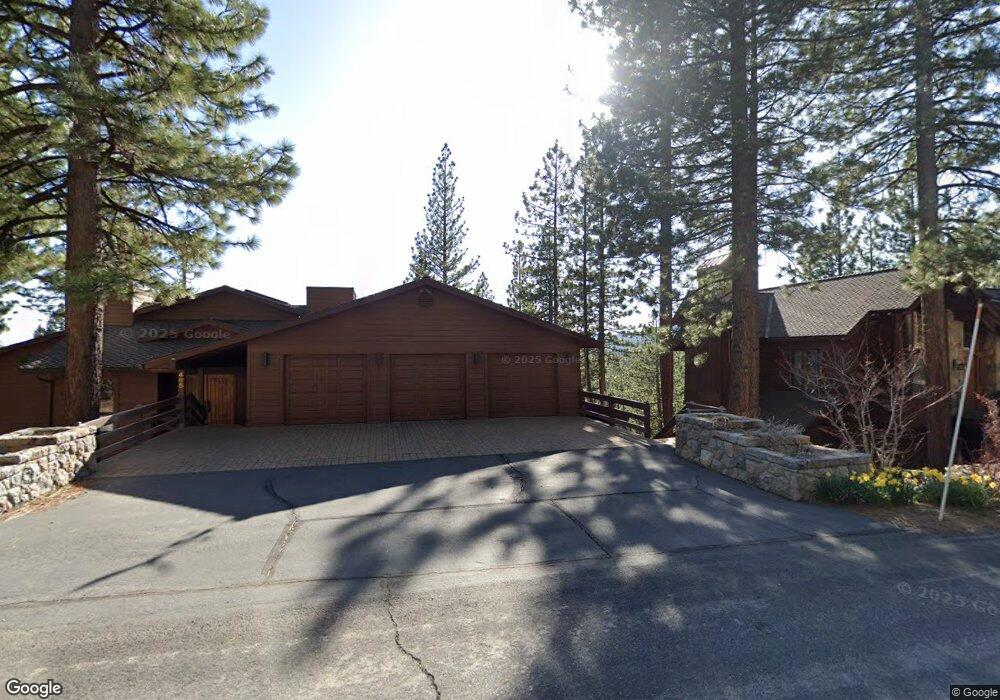
465 Eagle Dr Incline Village, NV 89451
Estimated Value: $1,828,000 - $6,440,000
5
Beds
5
Baths
4,704
Sq Ft
$952/Sq Ft
Est. Value
About This Home
This home is located at 465 Eagle Dr, Incline Village, NV 89451 and is currently estimated at $4,477,694, approximately $951 per square foot. 465 Eagle Dr is a home located in Washoe County with nearby schools including Incline Elementary School, Incline Middle School, and Incline High School.
Ownership History
Date
Name
Owned For
Owner Type
Purchase Details
Closed on
Apr 17, 2010
Sold by
Barnes Benjamin K
Bought by
Barnes Benjamin K and Barnes Robyn E
Current Estimated Value
Home Financials for this Owner
Home Financials are based on the most recent Mortgage that was taken out on this home.
Original Mortgage
$1,500,000
Outstanding Balance
$963,414
Interest Rate
4.37%
Mortgage Type
New Conventional
Estimated Equity
$3,514,280
Purchase Details
Closed on
Mar 11, 2010
Sold by
Costello Peter W and Costello Peggy C
Bought by
Barnes Benjamin K
Home Financials for this Owner
Home Financials are based on the most recent Mortgage that was taken out on this home.
Original Mortgage
$1,500,000
Outstanding Balance
$963,414
Interest Rate
4.37%
Mortgage Type
New Conventional
Estimated Equity
$3,514,280
Purchase Details
Closed on
Feb 20, 2001
Sold by
Koster Seymour and Koster Janice
Bought by
Costello Peter W and Costello Peggy C
Create a Home Valuation Report for This Property
The Home Valuation Report is an in-depth analysis detailing your home's value as well as a comparison with similar homes in the area
Home Values in the Area
Average Home Value in this Area
Purchase History
| Date | Buyer | Sale Price | Title Company |
|---|---|---|---|
| Barnes Benjamin K | -- | First American Title Iv | |
| Barnes Benjamin K | -- | First American Title Iv | |
| Barnes Benjamin K | $2,500,000 | First American Title Iv | |
| Costello Peter W | $2,465,000 | First American Title |
Source: Public Records
Mortgage History
| Date | Status | Borrower | Loan Amount |
|---|---|---|---|
| Open | Barnes Benjamin K | $1,500,000 |
Source: Public Records
Tax History Compared to Growth
Tax History
| Year | Tax Paid | Tax Assessment Tax Assessment Total Assessment is a certain percentage of the fair market value that is determined by local assessors to be the total taxable value of land and additions on the property. | Land | Improvement |
|---|---|---|---|---|
| 2025 | $20,283 | $814,501 | $441,000 | $373,501 |
| 2024 | $20,283 | $796,965 | $416,500 | $380,465 |
| 2023 | $19,711 | $728,389 | $367,500 | $360,889 |
| 2022 | $19,267 | $641,040 | $318,500 | $322,540 |
| 2021 | $18,728 | $588,422 | $269,500 | $318,922 |
| 2020 | $18,254 | $561,880 | $245,000 | $316,880 |
| 2019 | $17,637 | $558,653 | $245,000 | $313,653 |
| 2018 | $17,148 | $542,401 | $220,500 | $321,901 |
| 2017 | $16,672 | $531,078 | $208,250 | $322,828 |
| 2016 | $16,271 | $505,374 | $181,300 | $324,074 |
| 2015 | $4,060 | $514,351 | $181,300 | $333,051 |
| 2014 | $15,791 | $492,902 | $181,300 | $311,602 |
| 2013 | -- | $501,815 | $181,300 | $320,515 |
Source: Public Records
Map
Nearby Homes
- 483 Skylake Ct
- 449 Fairview Blvd
- 517 Driver Way
- 533 Driver Way
- 575 Fairview Blvd
- 387 2nd Tee
- 577 Eagle Dr
- 371 Mountain Lake Ct
- 400 Fairview Blvd Unit 98
- 400 Fairview Blvd Unit 174
- 400 Fairview Blvd Unit 16
- 400 Fairview Blvd Unit 64
- 400 Fairview Blvd Unit 86
- 400 Fairview Blvd Unit 113
- 1392 Tirol Dr
- 1360 Valais Way
- 954 Fairway Blvd Unit 4
- 982 Sand Iron Dr
- 654 Country Club Dr
- 948 Harold Dr Unit 15
- 471 Eagle Dr
- 457 Eagle Dr
- 464 Eagle Dr
- 455 Driver Way
- 467 Driver Way
- 473 Eagle Dr
- 451 Eagle Dr
- 473 Alpine View Dr
- 455 Fairview Blvd
- 471 Driver Way
- 469 Fairview Blvd
- 450 First Green Dr
- 477 Alpine View Dr
- 473 Fairview Blvd
- 446 First Green Dr
- 439 Driver Way
- 477 Driver Way
- 435 Fairview Blvd
- 481 Alpine View Dr
- 460 Second Tee Dr