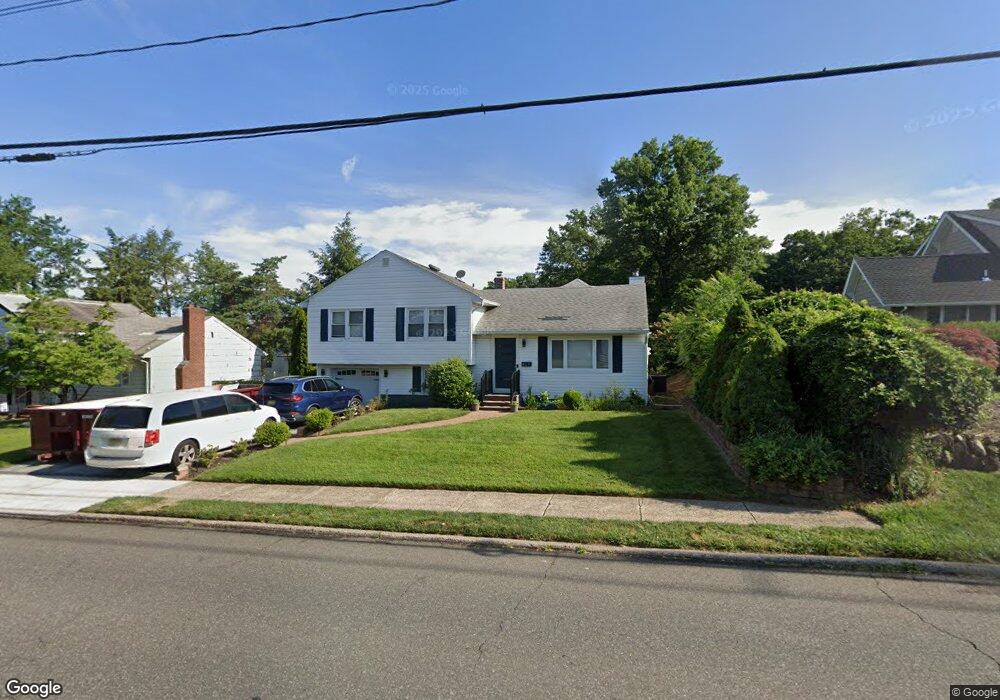
465 Henley Ave New Milford, NJ 07646
Estimated Value: $678,623 - $760,000
--
Bed
--
Bath
1,957
Sq Ft
$373/Sq Ft
Est. Value
About This Home
This home is located at 465 Henley Ave, New Milford, NJ 07646 and is currently estimated at $730,656, approximately $373 per square foot. 465 Henley Ave is a home located in Bergen County with nearby schools including New Milford High School, Englewood on the Palisades Charter School, and Teaneck Community Charter School.
Ownership History
Date
Name
Owned For
Owner Type
Purchase Details
Closed on
Apr 30, 1999
Sold by
Cheong Jong Sup
Bought by
Ibkarian Haroutioun and Apkarian Maral
Current Estimated Value
Home Financials for this Owner
Home Financials are based on the most recent Mortgage that was taken out on this home.
Original Mortgage
$144,000
Outstanding Balance
$36,837
Interest Rate
6.92%
Estimated Equity
$693,819
Create a Home Valuation Report for This Property
The Home Valuation Report is an in-depth analysis detailing your home's value as well as a comparison with similar homes in the area
Home Values in the Area
Average Home Value in this Area
Purchase History
| Date | Buyer | Sale Price | Title Company |
|---|---|---|---|
| Ibkarian Haroutioun | $191,000 | -- |
Source: Public Records
Mortgage History
| Date | Status | Borrower | Loan Amount |
|---|---|---|---|
| Open | Ibkarian Haroutioun | $144,000 |
Source: Public Records
Tax History Compared to Growth
Tax History
| Year | Tax Paid | Tax Assessment Tax Assessment Total Assessment is a certain percentage of the fair market value that is determined by local assessors to be the total taxable value of land and additions on the property. | Land | Improvement |
|---|---|---|---|---|
| 2025 | $13,223 | $583,200 | $385,300 | $197,900 |
| 2024 | $12,829 | $327,700 | $157,000 | $170,700 |
| 2023 | $12,200 | $327,700 | $157,000 | $170,700 |
| 2022 | $12,200 | $327,700 | $157,000 | $170,700 |
| 2021 | $11,233 | $327,700 | $157,000 | $170,700 |
| 2020 | $11,814 | $327,700 | $157,000 | $170,700 |
| 2019 | $11,610 | $327,700 | $157,000 | $170,700 |
| 2018 | $11,306 | $327,700 | $157,000 | $170,700 |
| 2017 | $11,076 | $327,700 | $157,000 | $170,700 |
| 2016 | $10,886 | $327,700 | $157,000 | $170,700 |
| 2015 | $10,667 | $327,700 | $157,000 | $170,700 |
| 2014 | $10,349 | $282,800 | $157,000 | $125,800 |
Source: Public Records
Map
Nearby Homes
- 463 Henley Ave
- 489 Henley Ave
- 433 Cypress Ct
- 461 Henley Ave
- 488 Henley Ave
- 201 River Edge Rd
- 484 Henley Ave
- 472 Henley Ave
- 126 N Queen St
- 107 Birch Ave
- 437 Cypress Ct
- 459 Henley Ave
- 197 River Edge Rd
- 487 Arbor Place
- 130 N Queen St
- 431 Cypress Ct
- 479 Arbor Place
- 196 River Edge Rd
- 460 Henley Ave
- 439 Cypress Ct