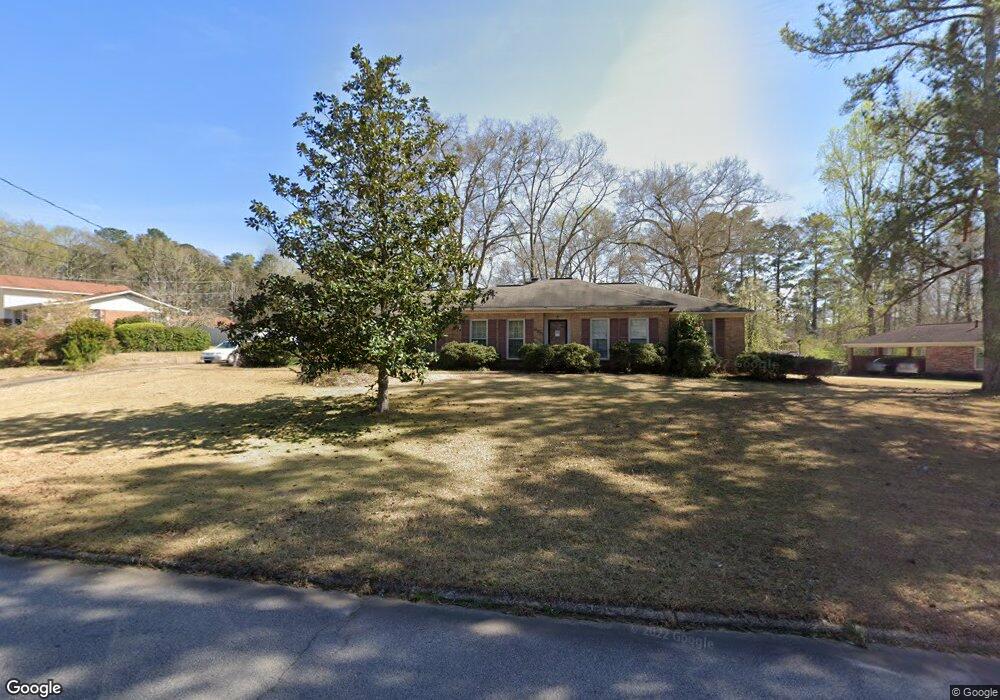
465 Hickory Terrace Lagrange, GA 30241
Estimated Value: $224,428 - $288,000
4
Beds
2
Baths
2,313
Sq Ft
$109/Sq Ft
Est. Value
About This Home
This home is located at 465 Hickory Terrace, Lagrange, GA 30241 and is currently estimated at $251,607, approximately $108 per square foot. 465 Hickory Terrace is a home located in Troup County with nearby schools including Franklin Forest Elementary School, Hollis Hand Elementary School, and Ethel W. Kight Elementary School.
Ownership History
Date
Name
Owned For
Owner Type
Purchase Details
Closed on
Sep 30, 2024
Sold by
Hearn Brenda F
Bought by
Hearn Samuel Glenn
Current Estimated Value
Purchase Details
Closed on
Jun 25, 2004
Sold by
Samuel G Hearn Interest
Bought by
Hearn Samuel Glenn and Hearn Brenda F
Purchase Details
Closed on
Jun 22, 2004
Sold by
Jacqueline C Hearn Walker
Bought by
Samuel G Hearn Interest
Purchase Details
Closed on
Jun 1, 2004
Sold by
Grace Crooms Hearn
Bought by
Jacqueline C Hearn Walker
Purchase Details
Closed on
Mar 7, 2003
Sold by
Jack Armstead Hearn
Bought by
Grace Crooms Hearn
Purchase Details
Closed on
Jan 1, 1972
Sold by
Jennifer Steven and Jennifer Caldwell
Bought by
Jack Armstead Hearn
Purchase Details
Closed on
Sep 4, 1971
Sold by
Lagrange Investment Co
Bought by
Jennifer Steven and Jennifer Caldwell
Purchase Details
Closed on
Sep 1, 1968
Sold by
Roy M Waller
Bought by
Lagrange Investment Co
Create a Home Valuation Report for This Property
The Home Valuation Report is an in-depth analysis detailing your home's value as well as a comparison with similar homes in the area
Home Values in the Area
Average Home Value in this Area
Purchase History
| Date | Buyer | Sale Price | Title Company |
|---|---|---|---|
| Hearn Samuel Glenn | -- | -- | |
| Hearn Samuel Glenn | -- | -- | |
| Samuel G Hearn Interest | -- | -- | |
| Jacqueline C Hearn Walker | -- | -- | |
| Grace Crooms Hearn | -- | -- | |
| Jack Armstead Hearn | $10,500 | -- | |
| Jennifer Steven | -- | -- | |
| Lagrange Investment Co | -- | -- |
Source: Public Records
Tax History Compared to Growth
Tax History
| Year | Tax Paid | Tax Assessment Tax Assessment Total Assessment is a certain percentage of the fair market value that is determined by local assessors to be the total taxable value of land and additions on the property. | Land | Improvement |
|---|---|---|---|---|
| 2024 | $2,091 | $78,652 | $10,000 | $68,652 |
| 2023 | $1,905 | $71,852 | $10,000 | $61,852 |
| 2022 | $1,788 | $66,052 | $10,000 | $56,052 |
| 2021 | $1,575 | $54,224 | $8,000 | $46,224 |
| 2020 | $1,575 | $54,224 | $8,000 | $46,224 |
| 2019 | $1,513 | $52,144 | $8,000 | $44,144 |
| 2018 | $1,370 | $47,404 | $8,672 | $38,732 |
| 2017 | $1,370 | $47,404 | $8,672 | $38,732 |
| 2016 | $1,330 | $46,088 | $8,672 | $37,416 |
| 2015 | $1,344 | $46,475 | $8,672 | $37,803 |
| 2014 | $1,286 | $44,485 | $8,672 | $35,813 |
| 2013 | -- | $46,467 | $8,672 | $37,795 |
Source: Public Records
Map
Nearby Homes
- 706 N Harlem Cir
- 109 Dogwood Dr
- 618 S Harlem Cir
- 616 S Harlem Cir
- 608 S Harlem Cir
- 606 S Harlem Cir
- 600 S Harlem Cir
- 210 Hearthstone Dr
- 131 Foch St
- 121 Ct
- 600,606,608,616 S Harlem
- 130 Clara Jean Ct
- 806 New Franklin Rd
- 305 Lenox Cir
- 121 de Groat St
- 114 Briarcliff Rd
- 105 Lenox Cir
- 101 Lenox Cir
- 900 North St
- 110 Russell St
- 361 Hickory Terrace
- 467 Hickory Terrace
- 469 Camelot Ct
- 468 Hickory Terrace
- 466 Hickory Terrace Unit 32
- 0 Camelot Ct Unit 8195774
- 464 Hickory Terrace
- 470 Hickory Terrace
- 353 Hickory Terrace
- 471 Camelot Ct
- 501 Hickory Terrace
- 501 Hickory Terrace Unit 1
- 473 Camelot Ct
- 473 Camelot Ct Unit 26
- 302 Valley Ct
- 401 Camelot Dr
- 401 Camelot Dr Unit 50
- 304 Valley Ct
- 341 Brookridge Dr
- 500 Hickory Terrace