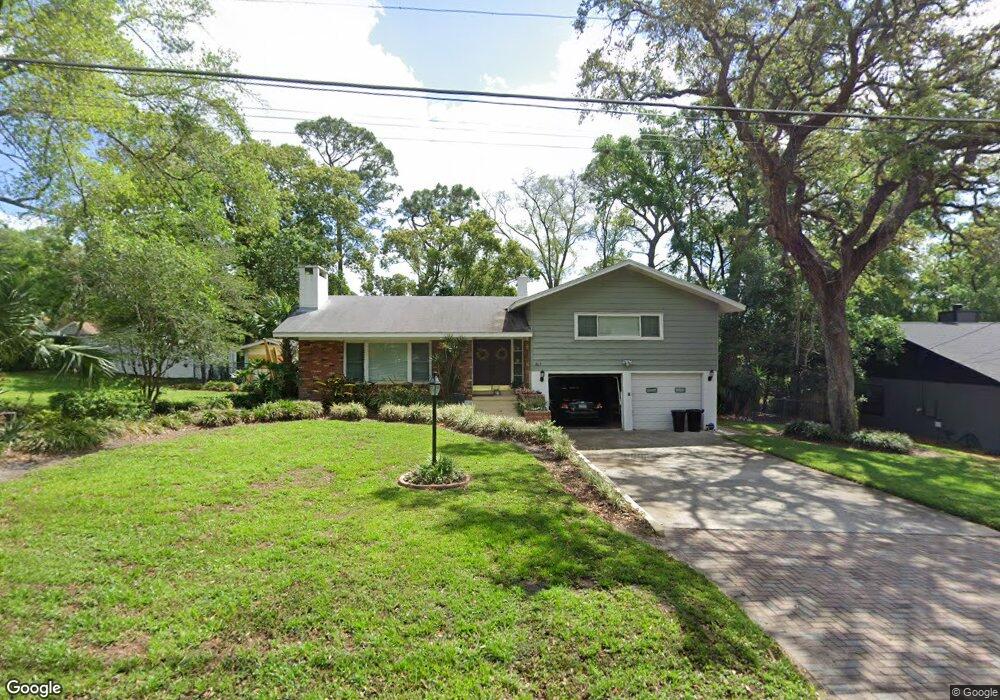
465 Homer Ave Longwood, FL 32750
Estimated Value: $336,519 - $389,000
3
Beds
2
Baths
1,381
Sq Ft
$260/Sq Ft
Est. Value
About This Home
This home is located at 465 Homer Ave, Longwood, FL 32750 and is currently estimated at $358,880, approximately $259 per square foot. 465 Homer Ave is a home located in Seminole County with nearby schools including Altamonte Elementary School, Lyman High School, and Milwee Middle School.
Ownership History
Date
Name
Owned For
Owner Type
Purchase Details
Closed on
Dec 21, 2005
Sold by
Butterfield Laura
Bought by
Billups Linda
Current Estimated Value
Home Financials for this Owner
Home Financials are based on the most recent Mortgage that was taken out on this home.
Original Mortgage
$182,200
Outstanding Balance
$101,942
Interest Rate
6.29%
Mortgage Type
Fannie Mae Freddie Mac
Estimated Equity
$256,938
Purchase Details
Closed on
Nov 13, 2003
Sold by
Butterfield Gail
Bought by
Butterfield Laura A
Home Financials for this Owner
Home Financials are based on the most recent Mortgage that was taken out on this home.
Original Mortgage
$80,000
Interest Rate
4.9%
Mortgage Type
Seller Take Back
Purchase Details
Closed on
Sep 1, 1994
Bought by
Billups Linda
Purchase Details
Closed on
Jul 1, 1981
Bought by
Billups Linda
Purchase Details
Closed on
Jan 1, 1974
Bought by
Billups Linda
Create a Home Valuation Report for This Property
The Home Valuation Report is an in-depth analysis detailing your home's value as well as a comparison with similar homes in the area
Home Values in the Area
Average Home Value in this Area
Purchase History
| Date | Buyer | Sale Price | Title Company |
|---|---|---|---|
| Billups Linda | $227,800 | -- | |
| Butterfield Laura A | $80,000 | Prestige Title Llc | |
| Billups Linda | $100 | -- | |
| Billups Linda | $65,000 | -- | |
| Billups Linda | $100 | -- |
Source: Public Records
Mortgage History
| Date | Status | Borrower | Loan Amount |
|---|---|---|---|
| Open | Billups Linda | $182,200 | |
| Previous Owner | Butterfield Laura A | $80,000 |
Source: Public Records
Tax History Compared to Growth
Tax History
| Year | Tax Paid | Tax Assessment Tax Assessment Total Assessment is a certain percentage of the fair market value that is determined by local assessors to be the total taxable value of land and additions on the property. | Land | Improvement |
|---|---|---|---|---|
| 2024 | $1,464 | $120,737 | -- | -- |
| 2023 | $1,427 | $117,220 | $0 | $0 |
| 2021 | $1,313 | $110,491 | $0 | $0 |
| 2020 | $1,296 | $108,965 | $0 | $0 |
| 2019 | $1,187 | $106,515 | $0 | $0 |
| 2018 | $1,164 | $104,529 | $0 | $0 |
| 2017 | $1,149 | $102,379 | $0 | $0 |
| 2016 | $1,157 | $100,975 | $0 | $0 |
| 2015 | $955 | $99,576 | $0 | $0 |
| 2014 | $955 | $98,786 | $0 | $0 |
Source: Public Records
Map
Nearby Homes
- 495 Howard Ave
- 222 Coachmans Cove
- 264 Agnes Ave
- 155 Hidden Woods Cove
- 940 Douglas Ave Unit 145
- 1841 North St
- 1823 North St
- 2142 Woodbridge Rd
- 492 S Pressview Ave
- 900 Red Fox Rd
- 950 Spring Garden St
- 480 Country Club Dr
- 113 Springwood Cir Unit 113D
- 971 Blackwood St
- 321 Ridgewood St
- 152 Springwood Cir Unit B
- 152 Peacock Dr
- 102 Tomoka Trail Unit 3D111
- 1055 Kensington Park Dr Unit 205
- 1055 Kensington Park Dr Unit 613