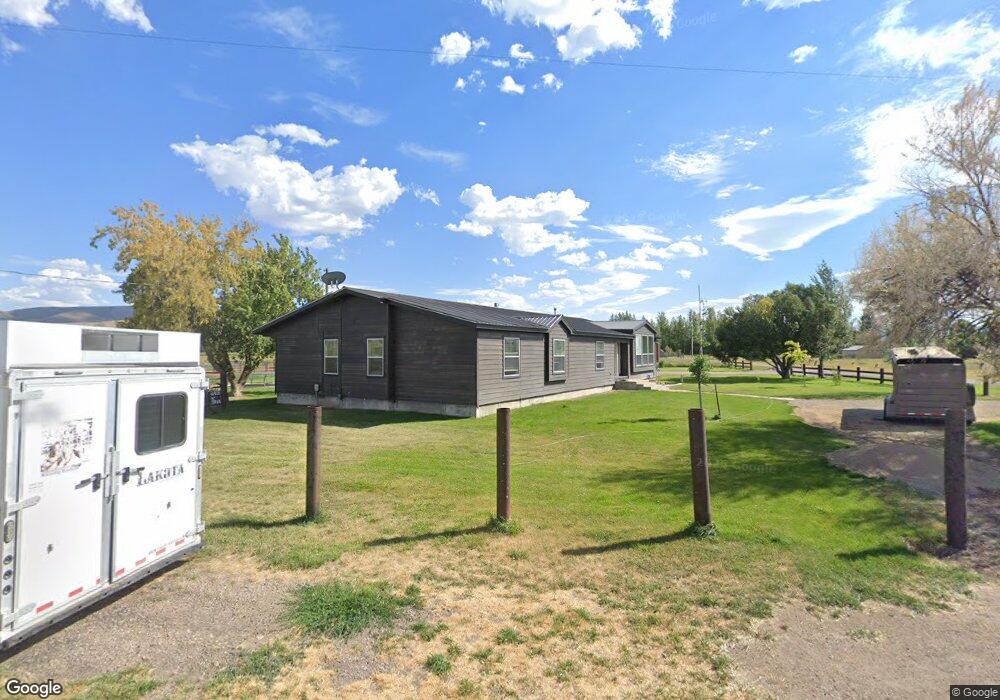
465 Horse Channel Rd Dingle, ID 83233
Estimated Value: $492,000 - $776,000
3
Beds
3
Baths
2,866
Sq Ft
$211/Sq Ft
Est. Value
About This Home
This home is located at 465 Horse Channel Rd, Dingle, ID 83233 and is currently estimated at $603,484, approximately $210 per square foot. 465 Horse Channel Rd is a home located in Bear Lake County with nearby schools including A.J. Winters Elementary School and Bear Lake High School.
Ownership History
Date
Name
Owned For
Owner Type
Purchase Details
Closed on
Jul 26, 2022
Sold by
Hyrum Sommer Tate
Bought by
Sommer Tate H and Sommer Emma
Current Estimated Value
Home Financials for this Owner
Home Financials are based on the most recent Mortgage that was taken out on this home.
Original Mortgage
$50,000
Outstanding Balance
$47,903
Interest Rate
5.78%
Mortgage Type
Credit Line Revolving
Estimated Equity
$555,581
Purchase Details
Closed on
Jan 25, 2021
Sold by
Sommer Tate H
Bought by
Sommer Tate H and Couch Emma
Home Financials for this Owner
Home Financials are based on the most recent Mortgage that was taken out on this home.
Original Mortgage
$266,000
Interest Rate
2.67%
Mortgage Type
New Conventional
Purchase Details
Closed on
Jun 20, 2014
Sold by
Federal Home Loan Mortgage Corporation
Bought by
Sommer Tate H
Create a Home Valuation Report for This Property
The Home Valuation Report is an in-depth analysis detailing your home's value as well as a comparison with similar homes in the area
Home Values in the Area
Average Home Value in this Area
Purchase History
| Date | Buyer | Sale Price | Title Company |
|---|---|---|---|
| Sommer Tate H | -- | First American Title | |
| Sommer Tate H | -- | First Amer Ttl Montpelier | |
| Sommer Tate H | -- | Northern Title Co |
Source: Public Records
Mortgage History
| Date | Status | Borrower | Loan Amount |
|---|---|---|---|
| Open | Sommer Tate H | $50,000 | |
| Previous Owner | Sommer Tate H | $266,000 |
Source: Public Records
Tax History Compared to Growth
Tax History
| Year | Tax Paid | Tax Assessment Tax Assessment Total Assessment is a certain percentage of the fair market value that is determined by local assessors to be the total taxable value of land and additions on the property. | Land | Improvement |
|---|---|---|---|---|
| 2025 | $1,637 | $519,991 | $6,731 | $513,260 |
| 2024 | $1,637 | $527,941 | $9,001 | $518,940 |
| 2023 | $1,414 | $500,345 | $57,410 | $442,935 |
| 2022 | $1,689 | $505,055 | $57,410 | $447,645 |
| 2021 | $1,336 | $341,923 | $40,203 | $301,720 |
| 2020 | $1,471 | $295,373 | $33,503 | $261,870 |
| 2019 | $1,629 | $321,883 | $33,503 | $288,380 |
| 2018 | $1,567 | $315,323 | $33,503 | $281,820 |
| 2017 | $1,511 | $301,593 | $33,503 | $268,090 |
| 2016 | $1,630 | $309,923 | $33,503 | $276,420 |
| 2015 | $1,661 | $583,783 | $316,463 | $267,320 |
| 2014 | $1,456 | $322,862 | $33,502 | $289,360 |
| 2010 | -- | $295,830 | $28,250 | $267,580 |
Source: Public Records
Map
Nearby Homes
- 4462 Dingle Rd
- 4040 Dingle Rd
- 302 4th S
- 74 Hunter Hill Rd
- 3400 E Sugar Loaf Rd E Unit NA
- 3400 Sugarloaf Rd
- 295 E 2nd St N
- 52 E 1st St S
- 270 N 50 E
- 102 S Main St
- 52 S Main St
- 0 U S Highway 89
- TBD U S Highway 89
- 59 W 1st S
- 500 W 2nd N
- 20086 U S 30
- 357 W 3rd St N
- 225 W 1st N Unit 9
- 719 Adams St
- 268 S 4th St