465 Indian Run Rd Glenmoore, PA 19343
Estimated Value: $511,000 - $1,320,000
4
Beds
4
Baths
4,019
Sq Ft
$264/Sq Ft
Est. Value
About This Home
This home is located at 465 Indian Run Rd, Glenmoore, PA 19343 and is currently estimated at $1,061,991, approximately $264 per square foot. 465 Indian Run Rd is a home located in Chester County with nearby schools including Springton Manor Elementary School, Downingtown Middle School, and Downingtown High School West.
Ownership History
Date
Name
Owned For
Owner Type
Purchase Details
Closed on
Jun 24, 2008
Sold by
Hoyland Bryce F and Hoyland Erika S
Bought by
Seibert F John and Seibert Jennifer
Current Estimated Value
Purchase Details
Closed on
Jan 16, 2008
Sold by
Seibert F John and Seibert Jennifer
Bought by
Seibert F John and Seibert Jennifer
Purchase Details
Closed on
Jun 16, 2004
Sold by
Hoyland Bryce F and Hoyland Erika S
Bought by
Seibert F John and Seibert Jennifer
Purchase Details
Closed on
Oct 7, 1998
Sold by
Mcbride Emma
Bought by
Hoyland Bryce F and Hoyland Erika S
Home Financials for this Owner
Home Financials are based on the most recent Mortgage that was taken out on this home.
Original Mortgage
$227,000
Interest Rate
6.68%
Create a Home Valuation Report for This Property
The Home Valuation Report is an in-depth analysis detailing your home's value as well as a comparison with similar homes in the area
Home Values in the Area
Average Home Value in this Area
Purchase History
| Date | Buyer | Sale Price | Title Company |
|---|---|---|---|
| Seibert F John | -- | None Available | |
| Seibert F John | -- | None Available | |
| Seibert F John | $735,000 | -- | |
| Hoyland Bryce F | $90,000 | T A Title Insurance Company |
Source: Public Records
Mortgage History
| Date | Status | Borrower | Loan Amount |
|---|---|---|---|
| Previous Owner | Hoyland Bryce F | $227,000 |
Source: Public Records
Tax History Compared to Growth
Tax History
| Year | Tax Paid | Tax Assessment Tax Assessment Total Assessment is a certain percentage of the fair market value that is determined by local assessors to be the total taxable value of land and additions on the property. | Land | Improvement |
|---|---|---|---|---|
| 2025 | $7,326 | $368,680 | $162,860 | $205,820 |
| 2024 | $7,326 | $368,680 | $162,860 | $205,820 |
| 2023 | $7,111 | $368,680 | $162,860 | $205,820 |
| 2022 | $6,932 | $368,680 | $162,860 | $205,820 |
| 2021 | $6,816 | $368,680 | $162,860 | $205,820 |
| 2020 | $6,777 | $368,680 | $162,860 | $205,820 |
| 2019 | $6,222 | $351,110 | $162,860 | $188,250 |
| 2018 | $6,222 | $351,110 | $162,860 | $188,250 |
| 2017 | $6,222 | $351,110 | $162,860 | $188,250 |
| 2016 | $5,849 | $351,110 | $162,860 | $188,250 |
| 2015 | $5,849 | $351,110 | $162,860 | $188,250 |
| 2014 | $5,849 | $351,110 | $162,860 | $188,250 |
Source: Public Records
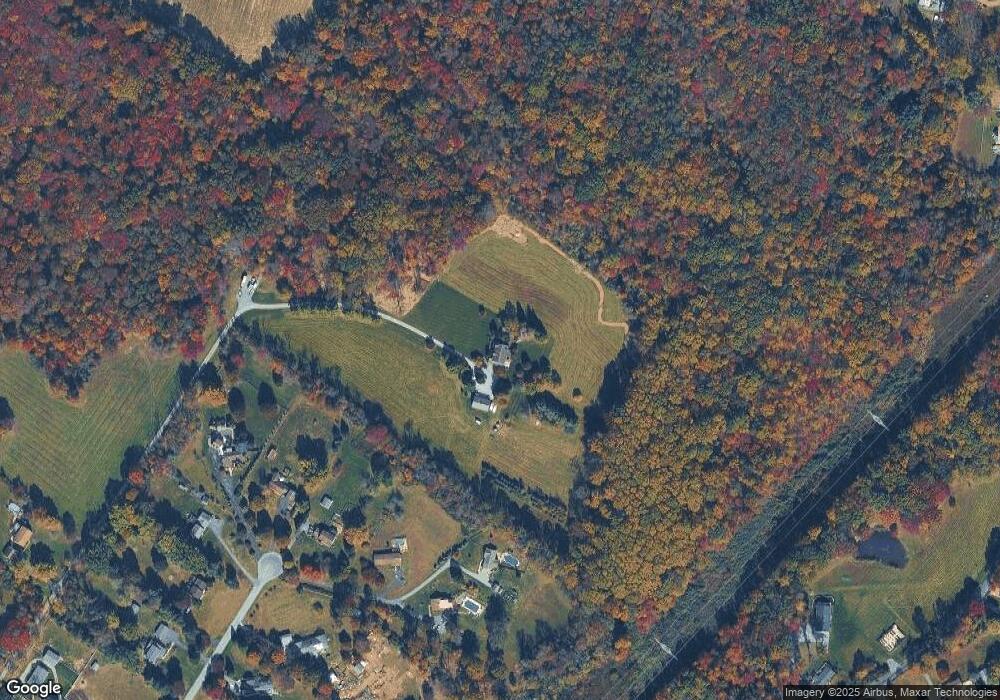
Map
Nearby Homes
- 0 Templin Rd
- 929 N Manor Rd
- 1360 N Manor Rd
- 843 N Manor Rd
- 0 Creek Rd Unit PACT2111370
- 220 Fairview Rd
- 155 Wyebrook Rd
- 130 Pumpkin Hill Rd
- 683 N Manor Rd
- 194 Joyce Ln
- 98 Erica Cir
- 13 Forsynthia Ln
- 16 Bridle Ct E
- Augusta Plan at Trails at Marsh Creek
- Parker Plan at Trails at Marsh Creek
- Sebastian Plan at Trails at Marsh Creek
- Addison Plan at Trails at Marsh Creek
- Kipling Plan at Trails at Marsh Creek
- Ethan Plan at Trails at Marsh Creek
- Nottingham Plan at Trails at Marsh Creek
- 68 Glen Manor Ln
- 60 Glen Manor Ln
- 64 Glen Manor Ln
- 70 Glen Manor Ln
- 71 Glen Manor Ln
- 61 Glen Manor Ln
- 140 Fairview Rd
- 50 Glen Manor Ln
- 51 Glen Manor Ln
- 41 Glen Manor Ln
- 30 Glen Manor Ln
- 100 Fairview Rd
- 390 Barneston Rd
- 31 Glen Manor Ln
- 130 Fairview Rd
- 20 Glen Manor Ln
- 110 Fairview Rd
- 471 Indian Run Rd
- 391 Barneston Rd
- 112 Fairview Rd