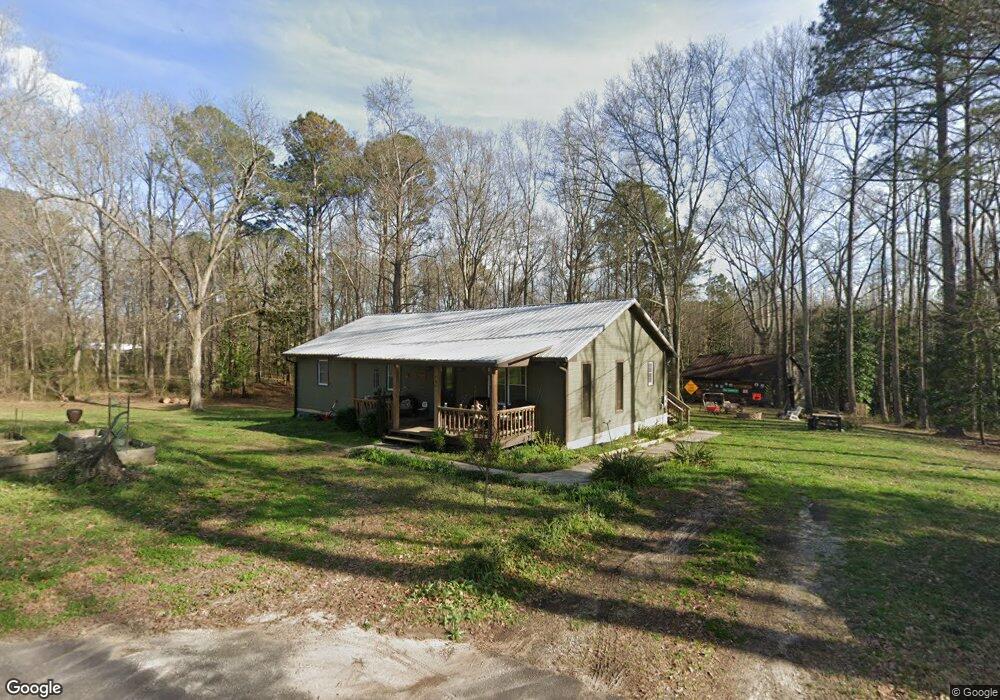
465 James Ave Tallapoosa, GA 30176
Estimated Value: $185,000 - $244,000
3
Beds
2
Baths
1,500
Sq Ft
$144/Sq Ft
Est. Value
About This Home
This home is located at 465 James Ave, Tallapoosa, GA 30176 and is currently estimated at $215,791, approximately $143 per square foot. 465 James Ave is a home located in Haralson County with nearby schools including Haralson County High School.
Ownership History
Date
Name
Owned For
Owner Type
Purchase Details
Closed on
Jan 15, 2009
Sold by
Secretary Of Housing
Bought by
Sanders David
Current Estimated Value
Home Financials for this Owner
Home Financials are based on the most recent Mortgage that was taken out on this home.
Original Mortgage
$60,867
Outstanding Balance
$38,596
Interest Rate
5.24%
Mortgage Type
New Conventional
Estimated Equity
$177,195
Purchase Details
Closed on
Apr 1, 2008
Sold by
Wells Fargo Bank
Bought by
Sec Of Housing & Urban
Purchase Details
Closed on
Apr 28, 2005
Sold by
Hight Judy C
Bought by
Copley Arthur
Home Financials for this Owner
Home Financials are based on the most recent Mortgage that was taken out on this home.
Original Mortgage
$86,541
Interest Rate
5.98%
Mortgage Type
FHA
Purchase Details
Closed on
Apr 25, 2002
Sold by
Baker Andy Clay and Baker Brenda L
Bought by
Hight Judy C
Purchase Details
Closed on
Mar 12, 1999
Sold by
Baker Andy Clay
Bought by
Baker Andy Clay and Baker Brenda L
Purchase Details
Closed on
Jun 23, 1988
Sold by
Baker Cindy Lynn
Bought by
Baker Andy Clay
Create a Home Valuation Report for This Property
The Home Valuation Report is an in-depth analysis detailing your home's value as well as a comparison with similar homes in the area
Home Values in the Area
Average Home Value in this Area
Purchase History
| Date | Buyer | Sale Price | Title Company |
|---|---|---|---|
| Sanders David | $40,000 | -- | |
| Sec Of Housing & Urban | -- | -- | |
| Wells Fargo Bank | -- | -- | |
| Copley Arthur | $87,900 | -- | |
| Hight Judy C | $64,500 | -- | |
| Baker Andy Clay | -- | -- | |
| Baker Andy Clay | -- | -- |
Source: Public Records
Mortgage History
| Date | Status | Borrower | Loan Amount |
|---|---|---|---|
| Open | Sanders David | $60,867 | |
| Previous Owner | Copley Arthur | $86,541 |
Source: Public Records
Tax History Compared to Growth
Tax History
| Year | Tax Paid | Tax Assessment Tax Assessment Total Assessment is a certain percentage of the fair market value that is determined by local assessors to be the total taxable value of land and additions on the property. | Land | Improvement |
|---|---|---|---|---|
| 2024 | $1,313 | $41,677 | $6,672 | $35,005 |
| 2023 | $1,497 | $45,757 | $6,672 | $39,085 |
| 2022 | $966 | $37,418 | $6,672 | $30,746 |
| 2021 | $970 | $35,990 | $6,672 | $29,318 |
| 2020 | $1,000 | $36,979 | $6,672 | $30,307 |
| 2019 | $1,013 | $36,120 | $6,672 | $29,448 |
| 2018 | $1,025 | $36,120 | $6,672 | $29,448 |
| 2017 | $1,040 | $33,415 | $6,672 | $26,743 |
| 2016 | $867 | $29,756 | $6,672 | $23,084 |
| 2015 | $855 | $29,181 | $6,672 | $22,510 |
| 2014 | $950 | $31,488 | $8,618 | $22,869 |
Source: Public Records
Map
Nearby Homes
- 438 Bowdon St
- 622 Cedartown Ave
- 110 Dunson Rd
- 194 Faye St
- 244 Monroe St
- 174 Faye St
- 77 McDonald Rd
- 0 Georgia 120 Unit 7646686
- 0 Georgia 120 Unit 10600882
- 711 Kay St
- 250 Kiker St
- 0 Broad St Unit 10614514
- 0 Broad St Unit 10614479
- 28 McDonald Ridge
- 117 White St
- 0 Providence Lake Rd Unit 10576961
- 0 Creek Dr Unit 148038
- 270 Head Ave
- 0 Cherokee Dr Unit 148037
- 281 Alewine Ave