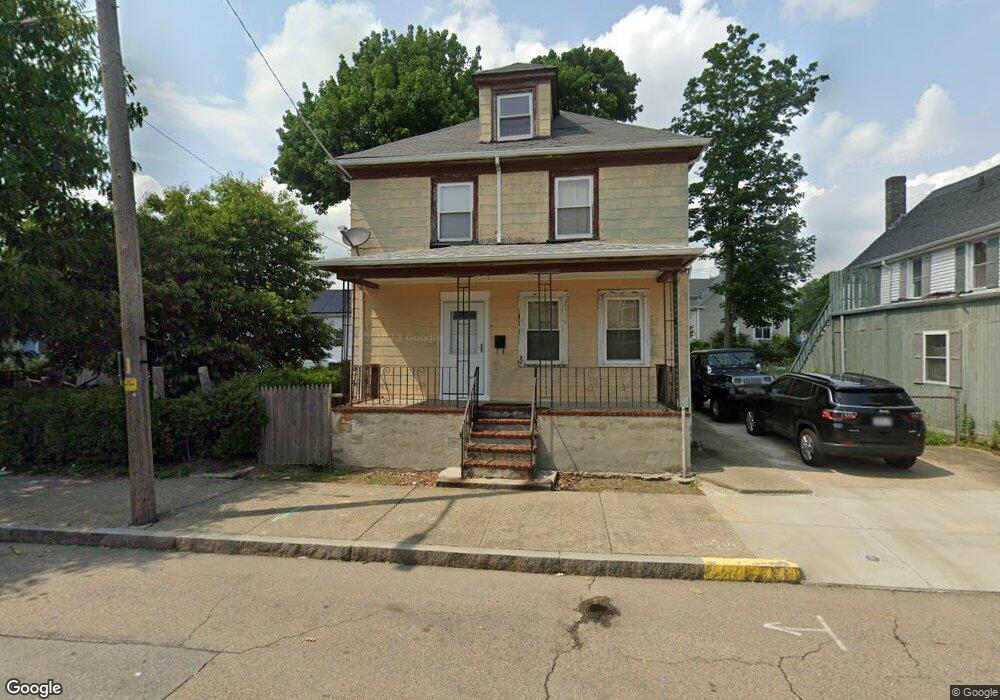
465 Kempton St New Bedford, MA 02740
Downtown New Bedford NeighborhoodEstimated Value: $348,000 - $449,000
3
Beds
1
Bath
1,410
Sq Ft
$276/Sq Ft
Est. Value
About This Home
This home is located at 465 Kempton St, New Bedford, MA 02740 and is currently estimated at $389,115, approximately $275 per square foot. 465 Kempton St is a home located in Bristol County with nearby schools including Sgt. William Carney Memorial Academy, Keith Middle School, and New Bedford High School.
Ownership History
Date
Name
Owned For
Owner Type
Purchase Details
Closed on
Nov 28, 2000
Sold by
Citizens Banks Of Mass
Bought by
Contreras Francisco A
Current Estimated Value
Purchase Details
Closed on
Aug 21, 2000
Sold by
Rebeiro Archie and Citizens Bank Of Mass
Bought by
Citizens Bank Of Mass
Create a Home Valuation Report for This Property
The Home Valuation Report is an in-depth analysis detailing your home's value as well as a comparison with similar homes in the area
Home Values in the Area
Average Home Value in this Area
Purchase History
| Date | Buyer | Sale Price | Title Company |
|---|---|---|---|
| Contreras Francisco A | $74,900 | -- | |
| Contreras Francisco A | $74,900 | -- | |
| Citizens Bank Of Mass | $56,000 | -- | |
| Citizens Bank Of Mass | $56,000 | -- |
Source: Public Records
Mortgage History
| Date | Status | Borrower | Loan Amount |
|---|---|---|---|
| Open | Citizens Bank Of Mass | $230,400 | |
| Closed | Citizens Bank Of Mass | $192,000 | |
| Closed | Citizens Bank Of Mass | $124,000 |
Source: Public Records
Tax History Compared to Growth
Tax History
| Year | Tax Paid | Tax Assessment Tax Assessment Total Assessment is a certain percentage of the fair market value that is determined by local assessors to be the total taxable value of land and additions on the property. | Land | Improvement |
|---|---|---|---|---|
| 2025 | $3,274 | $289,500 | $90,300 | $199,200 |
| 2024 | $3,126 | $260,500 | $83,900 | $176,600 |
| 2023 | $3,097 | $216,700 | $71,000 | $145,700 |
| 2022 | $2,803 | $180,400 | $64,500 | $115,900 |
| 2021 | $2,649 | $169,900 | $61,300 | $108,600 |
| 2020 | $2,636 | $163,100 | $61,300 | $101,800 |
| 2019 | $2,528 | $153,500 | $61,300 | $92,200 |
| 2018 | $2,385 | $143,400 | $61,300 | $82,100 |
| 2017 | $2,292 | $137,300 | $59,700 | $77,600 |
| 2016 | $2,188 | $132,700 | $58,100 | $74,600 |
| 2015 | $2,057 | $130,800 | $58,100 | $72,700 |
| 2014 | $1,953 | $128,800 | $56,500 | $72,300 |
Source: Public Records
Map
Nearby Homes