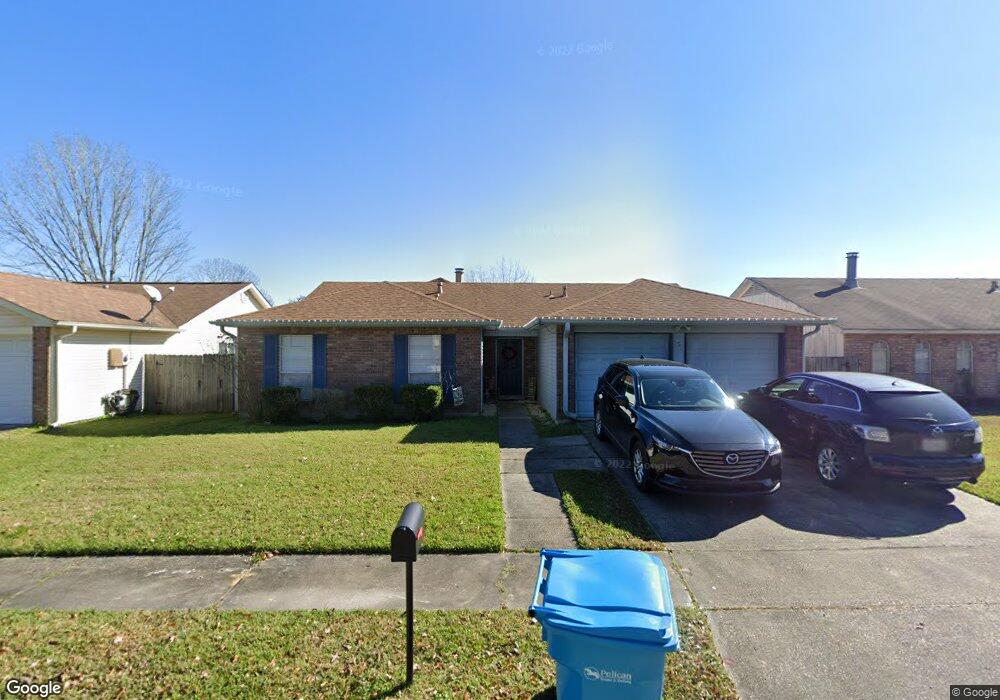
465 Longview Dr Destrehan, LA 70047
Estimated Value: $285,000 - $308,365
4
Beds
2
Baths
1,910
Sq Ft
$158/Sq Ft
Est. Value
About This Home
This home is located at 465 Longview Dr, Destrehan, LA 70047 and is currently estimated at $301,591, approximately $157 per square foot. 465 Longview Dr is a home located in St. Charles Parish with nearby schools including New Sarpy Elementary School, Ethel Schoeffner Elementary School, and Harry M. Hurst Middle School.
Ownership History
Date
Name
Owned For
Owner Type
Purchase Details
Closed on
Jan 11, 2017
Bought by
Powers Lacey and Powers Branson
Current Estimated Value
Home Financials for this Owner
Home Financials are based on the most recent Mortgage that was taken out on this home.
Original Mortgage
$192,218
Outstanding Balance
$158,766
Interest Rate
4.2%
Estimated Equity
$142,825
Purchase Details
Closed on
Dec 29, 2014
Sold by
Treadaway Gloria Helfrich
Bought by
Powers Branson R and Wilson Lacey R
Home Financials for this Owner
Home Financials are based on the most recent Mortgage that was taken out on this home.
Original Mortgage
$195,395
Interest Rate
4.05%
Mortgage Type
FHA
Purchase Details
Closed on
Jul 18, 2006
Sold by
Pecoul Michael John and Pecoul Ellen Brown
Bought by
Treadaway Gloria Helffrich
Create a Home Valuation Report for This Property
The Home Valuation Report is an in-depth analysis detailing your home's value as well as a comparison with similar homes in the area
Home Values in the Area
Average Home Value in this Area
Purchase History
| Date | Buyer | Sale Price | Title Company |
|---|---|---|---|
| Powers Lacey | -- | -- | |
| Powers Branson R | $199,000 | Crescent Title Llc | |
| Treadaway Gloria Helffrich | $199,000 | Choice Title |
Source: Public Records
Mortgage History
| Date | Status | Borrower | Loan Amount |
|---|---|---|---|
| Open | Powers Lacey | $192,218 | |
| Closed | Powers Lacey | -- | |
| Previous Owner | Powers Branson R | $195,395 |
Source: Public Records
Tax History Compared to Growth
Tax History
| Year | Tax Paid | Tax Assessment Tax Assessment Total Assessment is a certain percentage of the fair market value that is determined by local assessors to be the total taxable value of land and additions on the property. | Land | Improvement |
|---|---|---|---|---|
| 2024 | $1,747 | $24,820 | $5,790 | $19,030 |
| 2023 | $1,774 | $21,939 | $4,360 | $17,579 |
| 2022 | $1,683 | $21,939 | $4,360 | $17,579 |
| 2021 | $2,322 | $19,745 | $3,924 | $15,821 |
| 2020 | $2,578 | $21,939 | $4,360 | $17,579 |
| 2019 | $2,275 | $19,238 | $4,200 | $15,038 |
| 2018 | $2,257 | $19,238 | $4,200 | $15,038 |
| 2017 | $2,257 | $19,238 | $4,200 | $15,038 |
| 2016 | $2,267 | $19,238 | $4,200 | $15,038 |
| 2015 | $1,220 | $17,910 | $2,332 | $15,578 |
| 2014 | $1,076 | $17,032 | $2,332 | $14,700 |
| 2013 | $1,080 | $17,032 | $2,332 | $14,700 |
Source: Public Records
Map
Nearby Homes
- 411 River Oaks Dr
- 361 Evergreen Dr
- 162 Destrehan Dr
- 329 Longview Dr
- 403 Meadows Dr
- 247 Murray Hill Dr
- 21 Elmwood Ct
- 434 River Oaks Dr
- 436 River Oaks Dr
- 432 River Oaks Dr
- 441 River Oaks Dr
- 3744 Tara Dr
- 134 Ducayet Dr
- 67 Carriage Ln Unit B
- 1 Saint Paul St
- 87 Carriage Ln
- 209 211 213 Meadows Dr
- 211 Meadows Dr
- 41 Brandon Hall Dr Unit A
- 403 Ormond Blvd
- 473 Longview Dr
- 457 Longview Dr
- 464 Rosedale Dr
- 456 Rosedale Dr
- 472 Rosedale Dr
- 481 Longview Dr
- 449 Longview Dr
- 448 Rosedale Dr
- 480 Rosedale Dr
- 472 Longview Dr
- 456 Longview Dr
- 489 Longview Dr
- 480 Longview Dr
- 488 Rosedale Dr
- 448 Longview Dr
- 440 Rosedale Dr
- 488 Longview Dr
- 441 Longview Dr
- 497 Longview Dr
- 465 Rosedale Dr