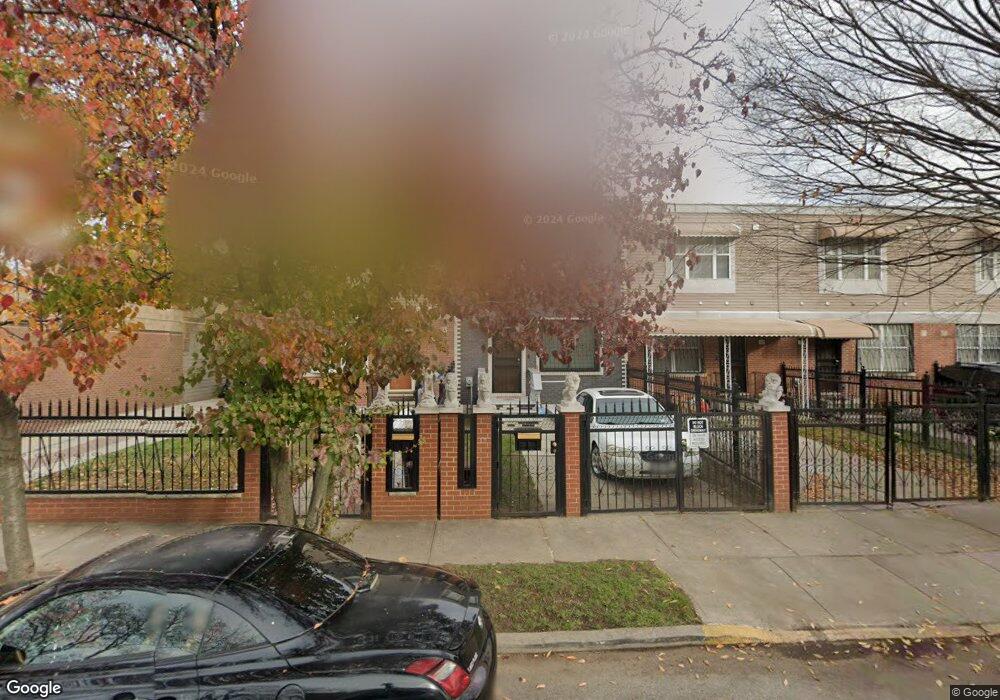
465 Osborn St Brooklyn, NY 11212
Brownsville NeighborhoodEstimated Value: $566,000 - $741,000
--
Bed
--
Bath
1,260
Sq Ft
$490/Sq Ft
Est. Value
About This Home
This home is located at 465 Osborn St, Brooklyn, NY 11212 and is currently estimated at $617,467, approximately $490 per square foot. 465 Osborn St is a home located in Kings County with nearby schools including P.S. 165 Ida Posner, P.S. 150 - Christopher, and P.S. 156 Waverly.
Ownership History
Date
Name
Owned For
Owner Type
Purchase Details
Closed on
Oct 22, 2003
Sold by
Nehemiah Housing Development Fund Compan
Bought by
Adams Cheryl I
Current Estimated Value
Home Financials for this Owner
Home Financials are based on the most recent Mortgage that was taken out on this home.
Original Mortgage
$70,000
Interest Rate
5.98%
Mortgage Type
Purchase Money Mortgage
Create a Home Valuation Report for This Property
The Home Valuation Report is an in-depth analysis detailing your home's value as well as a comparison with similar homes in the area
Home Values in the Area
Average Home Value in this Area
Purchase History
| Date | Buyer | Sale Price | Title Company |
|---|---|---|---|
| Adams Cheryl I | $105,000 | -- |
Source: Public Records
Mortgage History
| Date | Status | Borrower | Loan Amount |
|---|---|---|---|
| Previous Owner | Adams Cheryl I | $70,000 | |
| Closed | Adams Cheryl I | $20,000 |
Source: Public Records
Tax History Compared to Growth
Tax History
| Year | Tax Paid | Tax Assessment Tax Assessment Total Assessment is a certain percentage of the fair market value that is determined by local assessors to be the total taxable value of land and additions on the property. | Land | Improvement |
|---|---|---|---|---|
| 2025 | $3,654 | $37,920 | $15,420 | $22,500 |
| 2024 | $3,654 | $44,220 | $15,420 | $28,800 |
| 2023 | $3,147 | $45,540 | $15,420 | $30,120 |
| 2022 | $2,679 | $41,580 | $15,420 | $26,160 |
| 2021 | $2,572 | $34,140 | $15,420 | $18,720 |
| 2020 | $1,159 | $27,240 | $15,420 | $11,820 |
| 2019 | $2,050 | $27,240 | $15,420 | $11,820 |
| 2018 | $1,520 | $19,145 | $7,781 | $11,364 |
| 2017 | $1,066 | $18,062 | $6,698 | $11,364 |
| 2016 | $825 | $17,040 | $5,676 | $11,364 |
| 2015 | $555 | $17,520 | $5,676 | $11,844 |
| 2014 | $555 | $17,520 | $5,676 | $11,844 |
Source: Public Records
Map
Nearby Homes
- 797 Mother Gaston Blvd
- 258 Lott Ave
- 699 Sackman St
- 524 Chester St
- 504 Thatford Ave
- 546 Powell St
- 587 Osborn St
- 923 Rockaway Ave
- 555 Christopher Ave
- 563 Powell St
- 124 Lott Ave
- 578 Christopher Ave
- 546 Bristol St
- 931 Thomas S Boyland St
- 632 Osborn St
- 385 Amboy St
- 121 Riverdale Ave
- 892 Mother Gaston Blvd
- 363 Amboy St
- 664 Osborn St Unit 1