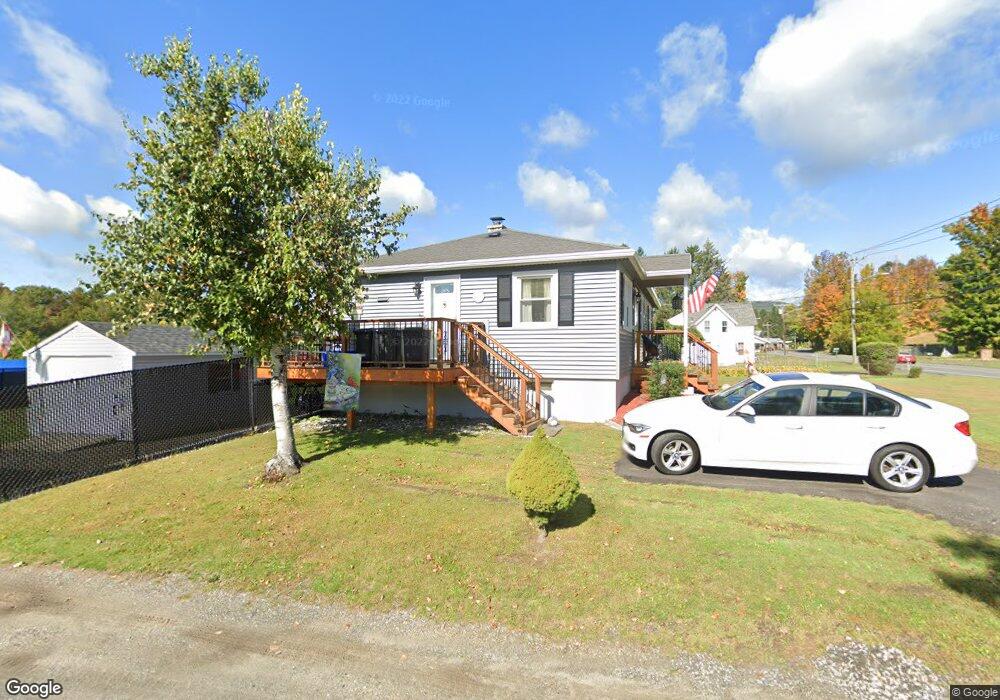
465 Pecks Rd Pittsfield, MA 01201
Estimated Value: $279,280 - $329,000
3
Beds
2
Baths
1,092
Sq Ft
$281/Sq Ft
Est. Value
About This Home
This home is located at 465 Pecks Rd, Pittsfield, MA 01201 and is currently estimated at $307,070, approximately $281 per square foot. 465 Pecks Rd is a home located in Berkshire County with nearby schools including Robert T. Capeless Elementary School, John T. Reid Middle School, and Taconic High School.
Ownership History
Date
Name
Owned For
Owner Type
Purchase Details
Closed on
Nov 5, 2014
Sold by
Hover Christine M and Martin Christine M
Bought by
Hover Christine M and Hover James E
Current Estimated Value
Home Financials for this Owner
Home Financials are based on the most recent Mortgage that was taken out on this home.
Original Mortgage
$132,000
Interest Rate
4.18%
Mortgage Type
New Conventional
Purchase Details
Closed on
Jul 2, 2004
Sold by
Marino Dona L and Marino Peter
Bought by
Martin Christine M
Purchase Details
Closed on
Nov 26, 2002
Sold by
Levardi Kurt and Read Martha
Bought by
Marino Peter and Marino Dona L
Purchase Details
Closed on
Mar 31, 1999
Sold by
Ramsey David M and Ramsey Freida M
Bought by
Levardi Kurt A and Read Martha L
Purchase Details
Closed on
Sep 30, 1992
Sold by
Arseneau John M and Arseneau Silvana M
Bought by
Ramsey David M and Ramsey Freida M
Create a Home Valuation Report for This Property
The Home Valuation Report is an in-depth analysis detailing your home's value as well as a comparison with similar homes in the area
Home Values in the Area
Average Home Value in this Area
Purchase History
| Date | Buyer | Sale Price | Title Company |
|---|---|---|---|
| Hover Christine M | -- | -- | |
| Hover Christine M | -- | -- | |
| Hover Christine M | -- | -- | |
| Martin Christine M | $128,000 | -- | |
| Martin Christine M | $128,000 | -- | |
| Marino Peter | $106,000 | -- | |
| Marino Peter | $106,000 | -- | |
| Levardi Kurt A | $99,500 | -- | |
| Levardi Kurt A | $99,500 | -- | |
| Ramsey David M | $85,000 | -- | |
| Ramsey David M | $85,000 | -- |
Source: Public Records
Mortgage History
| Date | Status | Borrower | Loan Amount |
|---|---|---|---|
| Closed | Hover Christine M | $132,000 |
Source: Public Records
Tax History
| Year | Tax Paid | Tax Assessment Tax Assessment Total Assessment is a certain percentage of the fair market value that is determined by local assessors to be the total taxable value of land and additions on the property. | Land | Improvement |
|---|---|---|---|---|
| 2025 | $4,474 | $249,400 | $65,700 | $183,700 |
| 2024 | $4,109 | $222,700 | $65,700 | $157,000 |
| 2023 | $3,739 | $204,100 | $60,700 | $143,400 |
| 2022 | $3,396 | $183,000 | $58,200 | $124,800 |
| 2021 | $3,344 | $173,700 | $58,200 | $115,500 |
| 2020 | $3,384 | $171,700 | $58,200 | $113,500 |
| 2019 | $3,156 | $162,500 | $52,700 | $109,800 |
| 2018 | $3,208 | $160,300 | $52,700 | $107,600 |
| 2017 | $3,029 | $154,300 | $50,700 | $103,600 |
| 2016 | $2,955 | $157,500 | $50,700 | $106,800 |
| 2015 | $2,844 | $157,500 | $50,700 | $106,800 |
Source: Public Records
Map
Nearby Homes
- 561 Pecks Rd
- 30 Lakewood Dr
- 14 Highland Ave
- 1 Lakewood Dr
- 144 Brombach St
- 2 Lakewood Cir
- 119 Orlando Ave
- 0 Oakhurst Ave
- 15 Orlando Ave
- 55 Newton Ave
- 0 Beacon Ave
- 36 Beacon Ave
- 30 Pinehurst Ave
- 140 Hancock Rd
- 0 Churchill St Unit 248259
- 20 Crystal St
- 68 Lakeway Dr
- 365 Churchill St
- 25 Calumet St
- 40 Pecks Rd
Your Personal Tour Guide
Ask me questions while you tour the home.